Sterling Infrastructure (STRL)
New Idea | Buy
$392.26|$12.0B Market Cap|$12.1B EV
March 2026
John Schipper | Conestoga Capital Advisors
Sterling Infrastructure (STRL): $392.26, $12.0B Mkt Cap, $12.1B EV
Headquartered in The Woodlands, Texas, STRL provides E-Infrastructure, Transportation, and Building Solutions across the United States. The company has transformed from a money-losing highway contractor into a $14B data center infrastructure platform. Revenue is organized into three segments:
- E-Infrastructure Solutions (69% of Q4 rev): Site development + electrical services (CEC) for data centers, semiconductor facilities, e-commerce distribution. +123% Y/y growth in Q4 (67% organic). Adj op margin: 22.2%. Serves hyperscalers including Amazon, Meta, and Google with 3-5 year project pipelines.
- Transportation Solutions (20% of Q4 rev): Highway, bridges, airports, storm drainage. Rocky Mountain core. +24% Y/y growth. Adj op margin: 12.2%. Over two years of backlog. Downsizing low-bid TX heavy highway business to improve mix.
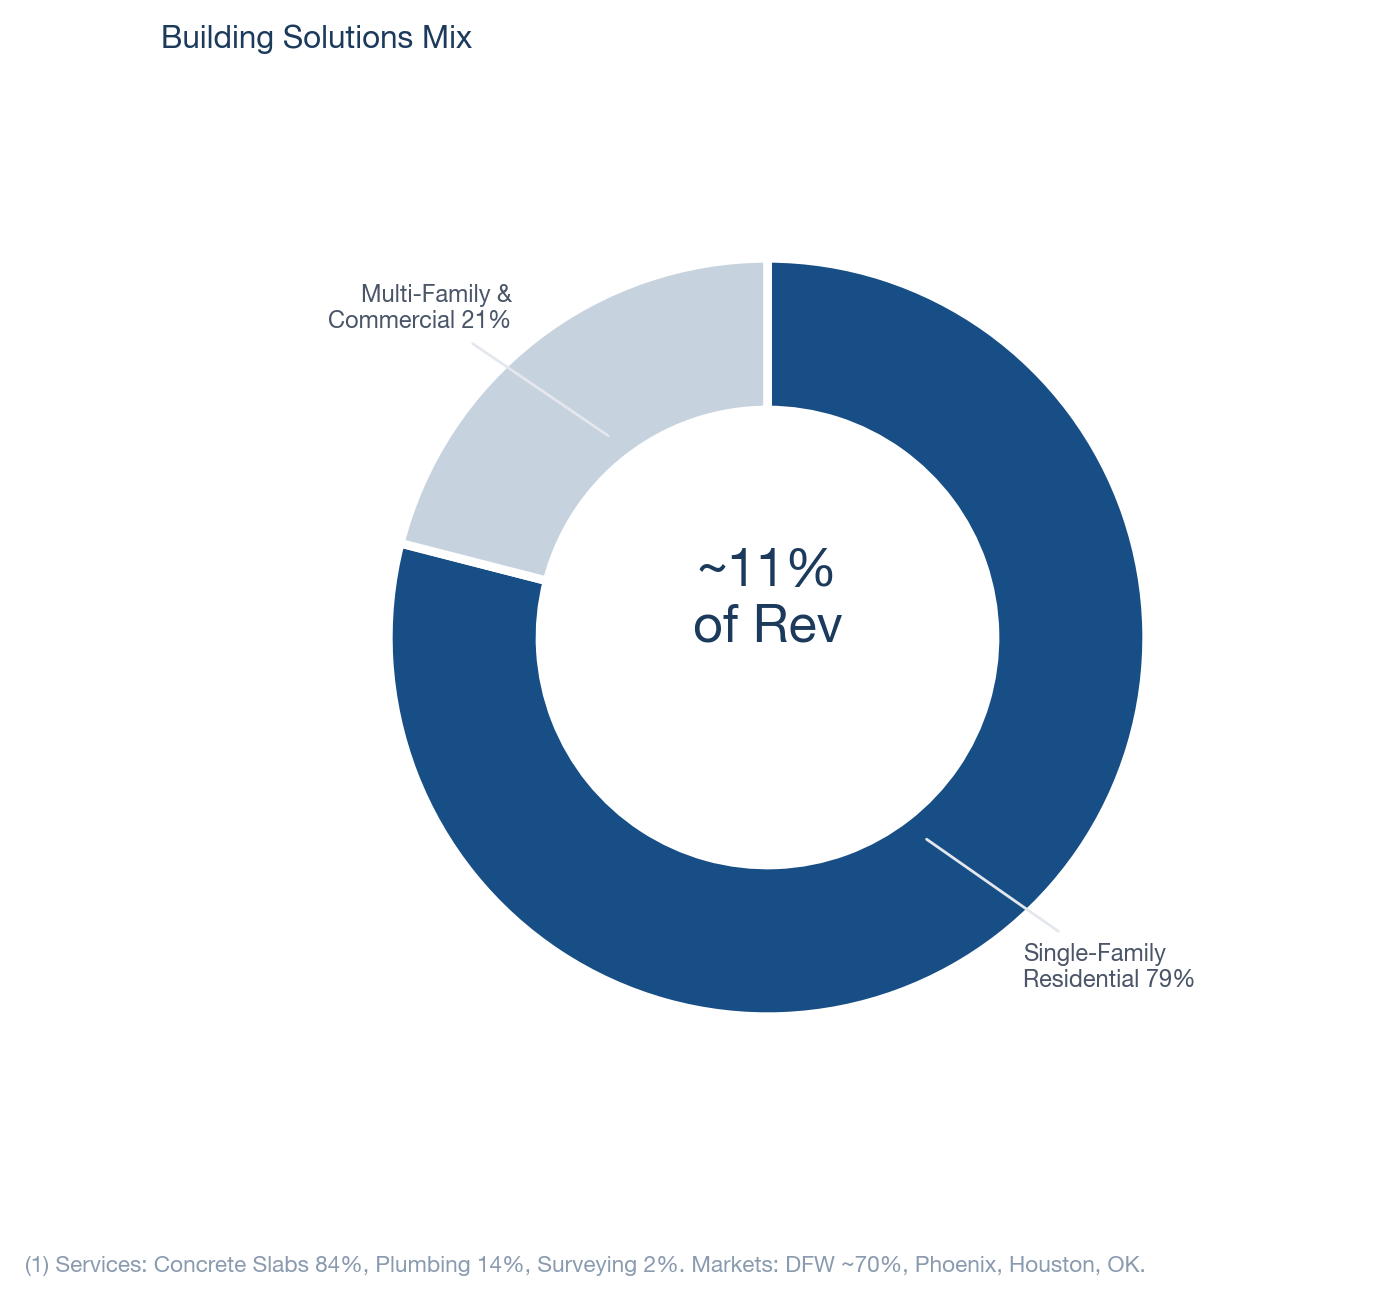
- Building Solutions (11% of Q4 rev): Residential/commercial concrete, plumbing. Dallas/Houston/Phoenix. -9% Y/y decline. Adj op margin: 10.0%. Cyclically depressed; positioned for share gains on recovery.
Key Operational Facts
Operating Footprint
- Integrated model: Site preparation (Plateau, Petillo) + electrical services (CEC) = single-source for mission-critical timelines.
- Scale: 3-4x larger than next competitor on large, complex DC projects. Can't replicate overnight.
- Geographic reach: Southeast core + Rocky Mountain + Texas expansion + Northeast (Petillo). Pacific Northwest entering 2027.
- CEC modular build facility: Tripling to 300,000+ sqft for prefab electrical components. Reduces field labor, improves margins.
Corporate Profile
- FY25 Revenue: $2,490M (+32% Y/y). FY25 Adj EPS: $10.88 (+53%).
- Balance Sheet: $391M cash, $291M debt. $100M net cash. $150M undrawn revolver.
- Backlog: $3.01B signed (+78%), $3.31B combined (+81%), $4.5B visibility pool.
- Mission-critical: 84% of E-Infra backlog (up from 80%).
- Book-to-burn: 1.64x in Q4. OCF: $440M (83% of EBITDA).
- 5th consecutive year of 35%+ EPS growth.
- CEO: Joe Cutillo (9 years). Led the entire transformation.
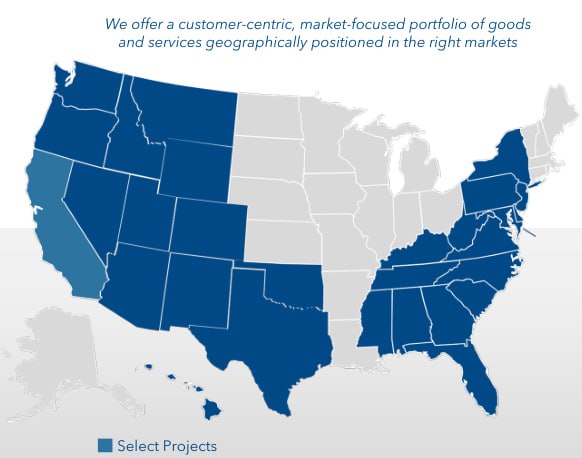
Geographic footprint. Source: STRL Q4 2025 Earnings Presentation.
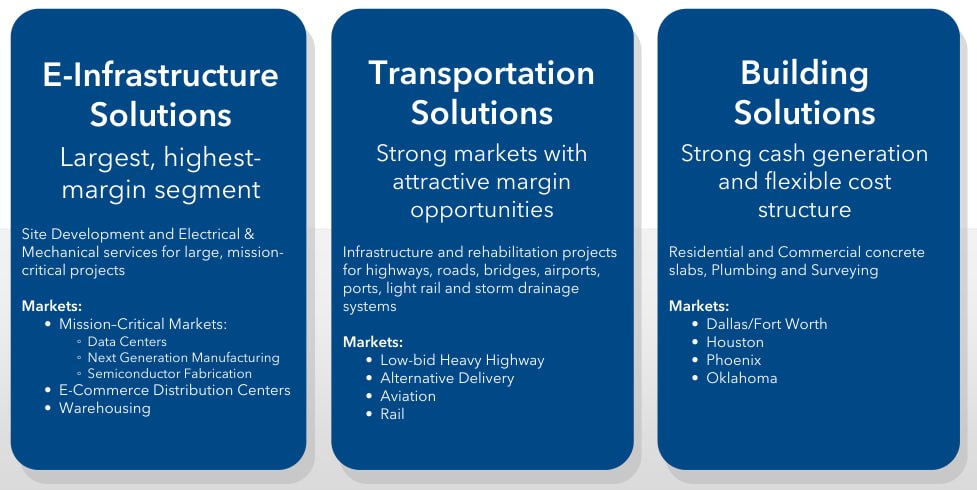
Three business segments. Source: STRL Q4 2025 Earnings Presentation.
Up / Down-Market Capture vs. R2500G
~1 Year | Ticker: STRL US | Index: R2500G
| #Up_Mkt | #Down_Mkt |
|---|
| Count | 8 | 4 |
| Avg Stock Return | 17.2% | -2.2% |
| Avg Index Return | 3.9% | -1.2% |
| Relative Return | 4.4x | -1.8x |
~3 Years | Ticker: STRL US | Index: R2500G
| #Up_Mkt | #Down_Mkt |
|---|
| Count | 21 | 15 |
| Avg Stock Return | 14.8% | 1.0% |
| Avg Index Return | 5.3% | -3.3% |
| Relative Return | 2.8x | -0.3x |
~5 Years | Ticker: STRL US | Index: R2500G
| #Up_Mkt | #Down_Mkt |
|---|
| Count | 39 | 21 |
| Avg Stock Return | 12.5% | -0.4% |
| Avg Index Return | 5.0% | -4.1% |
| Relative Return | 2.5x | 0.1x |
Capture framework compares average STRL performance vs. the R2500G across up-market and down-market periods. High-beta growth profile: amplifies upside 2.5-4.4x. Downside capture improves over longer horizons (turns net positive at 5Y). Sources: Q4 2025 earnings call, 10-K, company reports. FY26 guidance: Rev $3.05-3.2B, Adj EPS $13.45-14.05, Adj EBITDA $626-659M.
Investment Thesis: Why STRL Works
1. Transformation Complete: From Money-Losing Highway Contractor to DC Infrastructure Platform
- E-Infra growing +123% Y/y (67% organic), the biggest segment is the highest margin and fastest growing. This is the inverse of the typical E&C model.
- $4.5B visibility pool (signed backlog + unsigned awards + future phase) provides 18-24 months of coverage at current run rates.
- Mission-critical work is 84% of E-Infra backlog (up from 80%), driving margin durability.
2. CEC Cross-Sell Creates Integrated Moat
- Site development + electrical = single-source solution for hyperscalers on mission-critical timelines. "If site dev is even a couple weeks late, the total project gets delayed months."
- CEC Q4 revenue +21%. Texas market "on fire." CEC modular facility tripling to 300k sqft for prefab electrical components.
- Combined offering already driving margin improvement. Cutillo: "ahead of schedule and more optimistic about putting these two together."
3. Multi-Year Secular Demand with Multiple Waves
- Data centers (now): Hyperscalers talking "bigger builds, more builds" with 3-5 year pipelines. Projects evolving from data centers to data campuses.
- Semiconductor (next wave, ~2027+): Micron $100B, CHIPS Act $450B+. Projects 7-10 years vs DC's 3 years. Total scope approaching $1B per project.
- Geographic expansion: Texas is on fire. Meta $10B El Paso campus. Pacific Northwest entering 2027. Ohio/Indiana potential.
4. Rare Compounder Profile in E&C
- 5th consecutive year of 35%+ EPS growth. FY25 Adj EPS $10.88 (+53%). FY26E midpoint implies +26%.
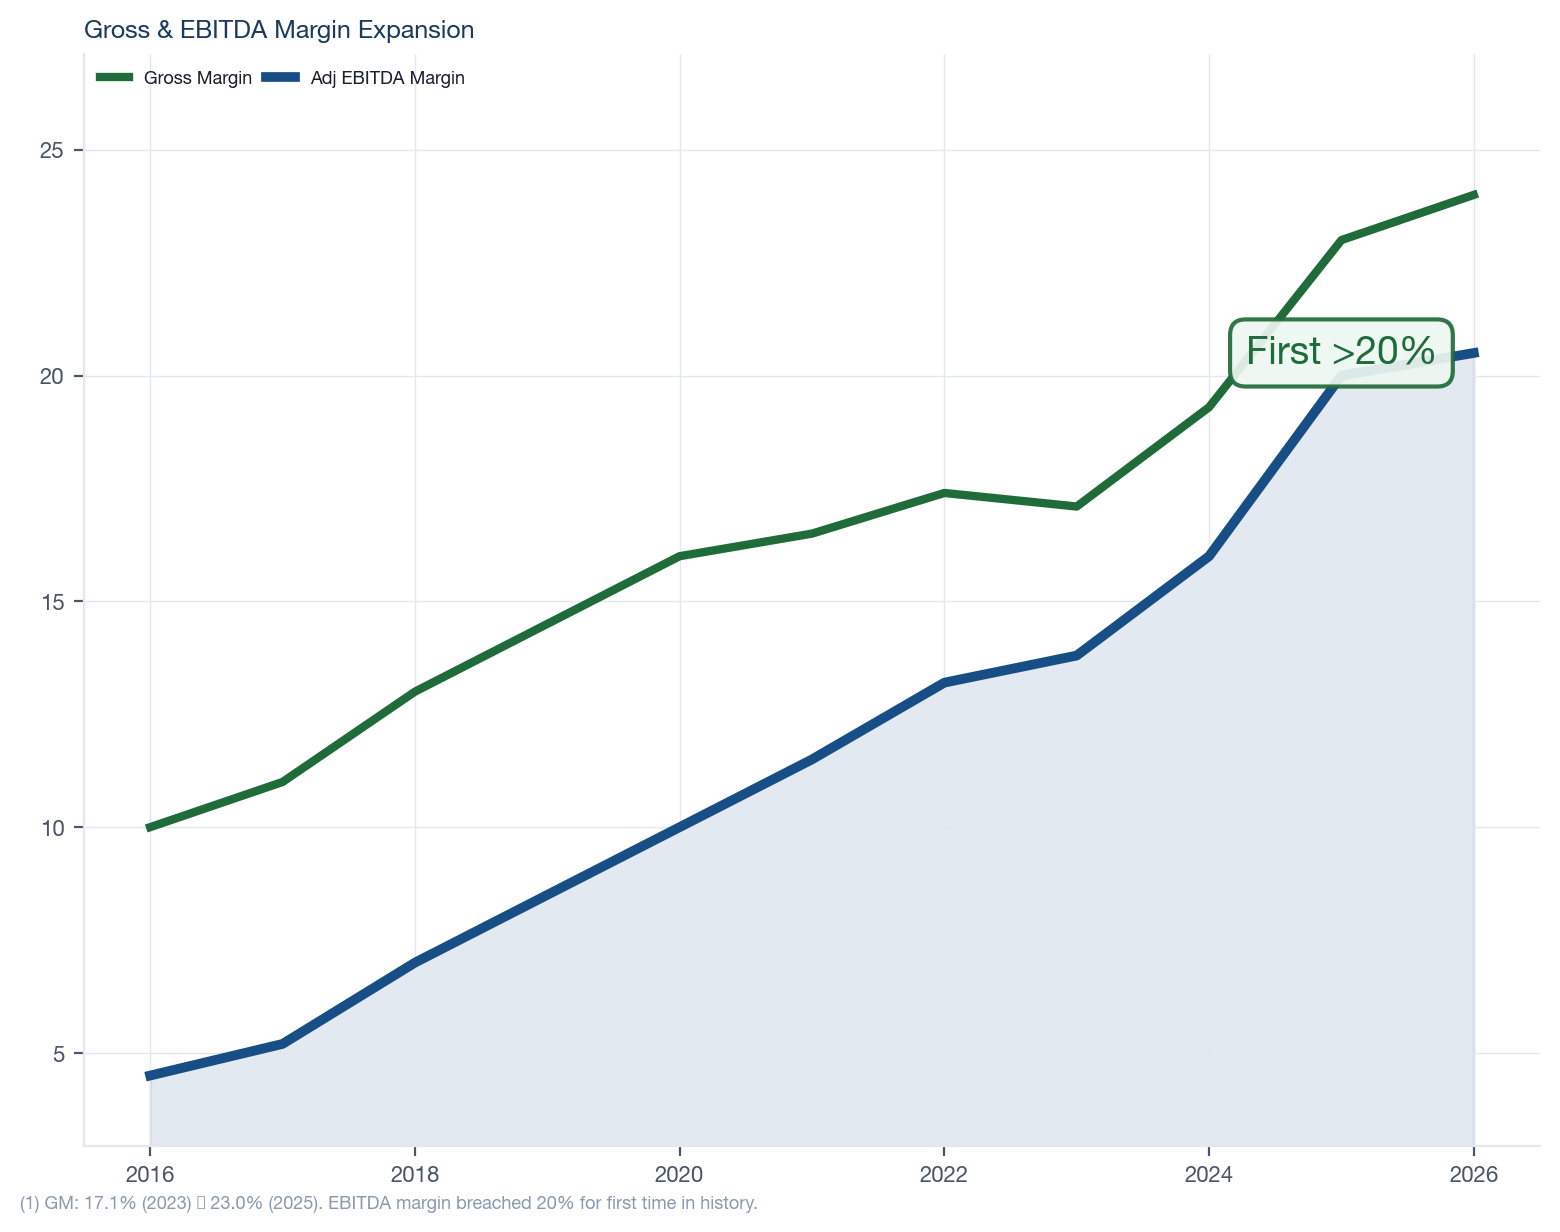
- Gross margins reached 23% and EBITDA margins exceeded 20% for first time in history.
- OCF: $440M. FCF conversion to EBITDA ~80%+. Net cash balance sheet with $150M undrawn revolver.
Investment Summary: Growth Drivers, Key Risks, What to Watch
Growth Drivers
- E-Infra guided +40%+ revenue growth in FY26. Legacy site dev +20%+ organic. Supported by $4.5B visibility pool.
- CEC cross-sell with site development creates integrated offering. Texas market accelerating. Margin expansion path toward 25%+.
- Semiconductor is the next wave: CHIPS Act, Micron, pharma. 7-10 year projects approaching $1B each.
- Geographic expansion: Texas, Pacific Northwest, Northeast. Each new geography is a multi-year growth vector.
- AI adoption: 15-20% incremental PM capacity from first pilots. Six AI projects now underway.
Key Risks
- DC cycle duration: if 2-3 year phenomenon, multiple compresses 35-50%. Solar over-ordering parallel is the bear case.
- Customer concentration is unstated. DC subset of E-Infra is the largest component but exact % not disclosed.
- Hyperscaler capex slowdown would directly impact the order book. Flow-through to backlog untested.
- CEC integration execution. New geographic ramps carry temporarily lower margins.
- Building Solutions headwinds persist. Tough first half 2026, inventory overhang on recovery.
- At ~27x FY26E P/E, premium valuation requires sustained execution.
What to Watch
- DC concentration: exact % of E-Infra revenue and top customer concentration. Can't model AI capex sensitivity without this.
- CEC cross-sell: named joint awards in H1 2026 in Texas. Margin accretion from combined site + electrical.
- Backlog quality: cancellation provisions, contractual protections, duration. Is 1.64x book-to-burn sustainable?
- Semi pipeline: which CHIPS Act projects award in 2026? Timing matters for 2027+ revenue.
- Moat durability: does advantage hold when DC supply normalizes? Scale vs. temporary supply constraint.
Core takeaway: The case rests on a durable secular buildout (DC + semi + reshoring) meeting a rare scale advantage in mission-critical site infrastructure. Premium valuation requires the demand cycle to be structural, not cyclical.
Management & Capital Allocation: Operator-Led Transformation
Management
- CEO Joe Cutillo (9 years): Mechanical engineer. Led the entire strategic transformation from money-losing highway contractor to $14B DC infrastructure platform. "None of us have seen this in our career."
- CFO Sharon Villaverde (<1yr): From Dycom Industries (VP/CAO). Infrastructure M&A expertise. Hired alongside COO, bench deepening.
- COO Dan Govin (<1yr): From Quanta Services (President, Quanta West). Electrical utility background. Directly relevant to CEC integration.
- EVP Ron Ballschmiede (9yr): Former CFO of Chicago Bridge & Iron. Finance backbone through the transformation.
- VP IR Noelle Dilts (2yr): Former Stifel equity research analyst covering E&C. Notable: knows exactly what buyside wants to hear.
Capital Allocation
- M&A is the transformation engine: Plateau, Petillo, CEC. All at 4-6x EBITDA. Focused on geographic expansion + electrical footprint + services/skills.
- Share repurchases: $74M in FY25 at avg $168.72. $26M in Q4 at avg $310.09. $374M remaining authorization.
- Capex stepping up: $100-110M in FY26 (from $77M). Equipment fleet, Rocky Mountain build-out, modular facility.
- Liquidity: $391M cash, $291M debt = $100M net cash. $150M undrawn revolver.
- OCF: $440M in FY25. FCF conversion to EBITDA ~80%+ guided for FY26.
- Pipeline: "Seeing more high-quality acquisition targets in the market today than a year ago." Owners see the opportunity ahead but can't fund the growth alone.
- Focus: Geographic expansion of site dev + incremental electrical footprint + mechanical (natural progression). Fourth leg only if right strategic fit.
Why the two C-suite hires matter: CFO from Dycom and COO from Quanta, hired simultaneously, signals bench deepening for scale, not succession planning. Both bring direct E&C infrastructure expertise relevant to the next phase of growth.
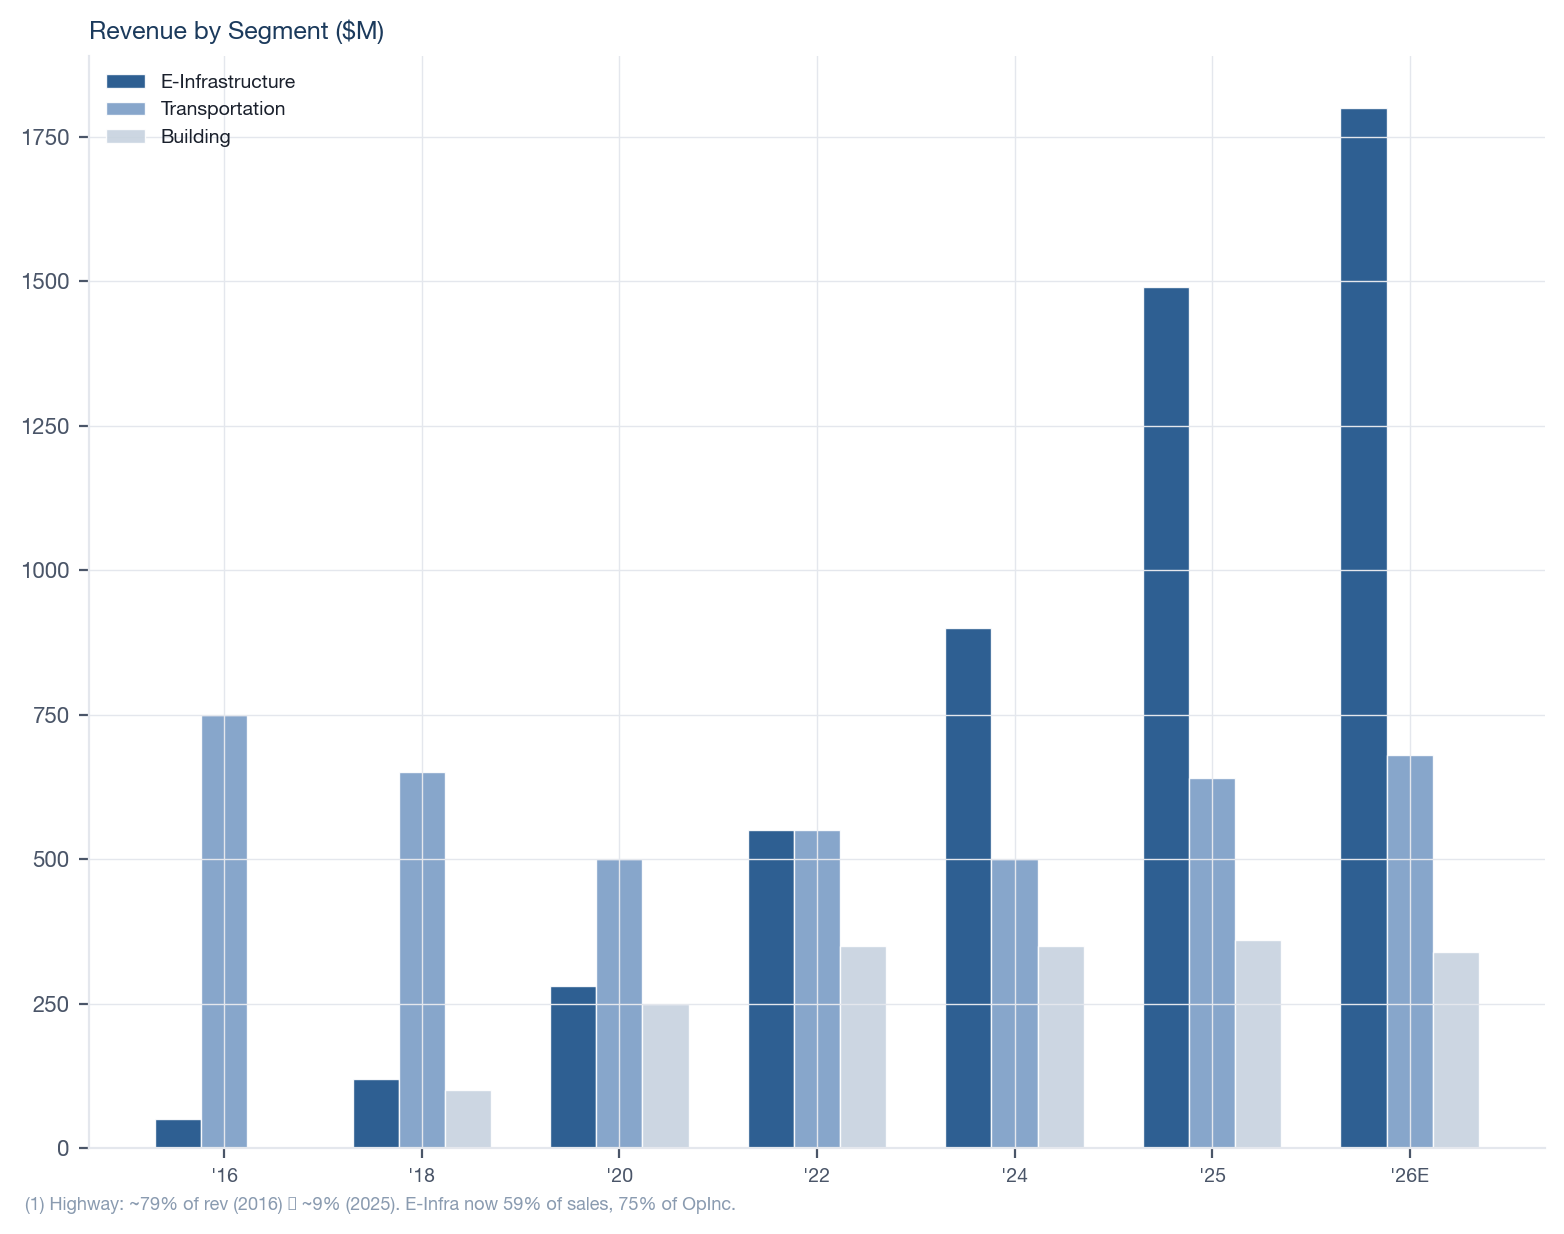
End-Market Mix: Revenue by Segment
| ($M) |
FY23 |
FY24 |
FY25 |
Q4 25 |
FY26E Guide |
| E-Infrastructure Solutions | $1,096 | $1,191 | $1,889 | $521 | E-Infra +40%+ |
| Y/y | — | +8.7% | +58.6% | +123% | +40%+ |
| % of total | 55.6% | 56.3% | 75.9% | 68.9% | ~70%+ |
|
| Transportation Solutions | $533 | $555 | $649 | $153 | Low-mid single digit |
| Y/y | — | +4.1% | +16.9% | +24% | +LSD-MSD |
| % of total | 27.0% | 26.2% | 26.1% | 20.2% | ~18% |
|
| Building Solutions | $343 | $370 | $348 | $82 | HSD-LDD decline |
| Y/y | — | +7.9% | -5.9% | -9% | -8% to -12% |
| % of total | 17.4% | 17.5% | 14.0% | 10.8% | ~10% |
|
| Total Revenue | $1,972 | $2,116 | $2,490 | $756 | $3,050-3,200 |
| Y/y | — | +7.3% | +17.7% | +69% | ~+25% |
Key Mix Observations
- E-Infrastructure rapidly becoming ~70%+ of revenue. Biggest segment is highest-margin and fastest-growing. Operating leverage is enormous.
- Transportation declining as % of total despite solid absolute growth. Downsizing low-bid TX heavy highway business improves margin mix.
- Building is cyclically depressed. Positioned for share gains on recovery (Houston, Arizona). Potential tuck-in acquisitions at depressed multiples.
- Organic Q4 growth was 36%. E-Infra organic growth was 67%. This is not just M&A-driven.
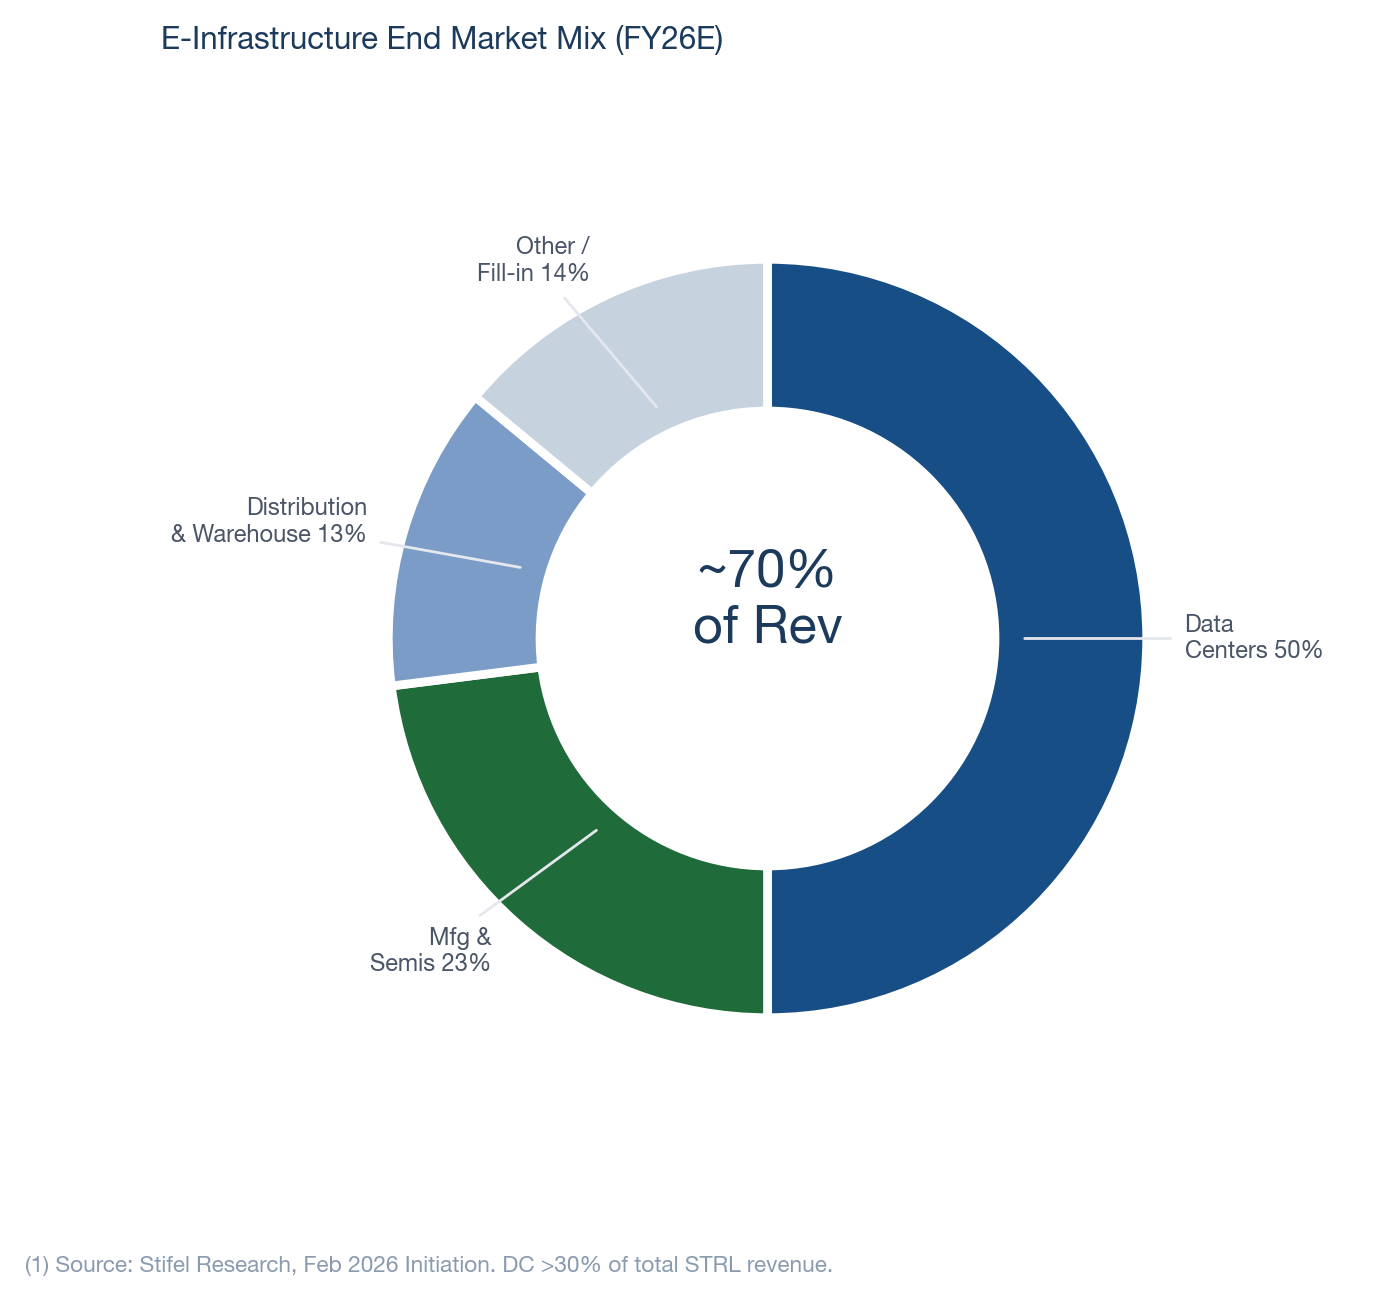
E-Infra end market mix. Source: Stifel Research.
Revenue Decomposition: Type of Work, Contract Mix & E-Infra End Markets
Revenue by Type of Work (FY26E)
| Type | % of Revenue |
|---|
| Non-Resi Site Development | 48% |
| Non-Resi Electrical & Mechanical | 15% |
| Paving, Roads, Runway & Bridge | 23% |
| Residential Concrete Slabs | 12% |
| Residential Plumbing | 2% |
Revenue by Contract Type
| Contract Type | % of Revenue |
|---|
| Lump Sum (skews E-Infrastructure) | 49% |
| Fixed-Unit Price (skews Transportation) | 36% |
| Residential & Other | 15% |
Both lump sum and fixed-unit price contracts enable potential margin upside assuming accurate estimating and strong execution.
E-Infrastructure End Market Mix
| End Market | % of E-Infra |
|---|
| Data Centers | 50% |
| Manufacturing & Semis | 23% |
| Distribution & Warehouse | 13% |
| Other Non-Resi / Fill-in | 14% |
Key Observations
- DC >30% of total STRL revenue, >50% of E-Infra. DC work is the highest-margin within E-Infra.
- Manufacturing/Semis at 23% of E-Infra provides CHIPS Act exposure without dedicated effort.
- E-commerce distribution backlog +150% Y/y in Q3 2025 as Amazon reinvests. Project sizes 2.0-2.5x larger than historical, with EV charging adding complexity.
- Fill-in projects (~15% of E-Infra, ~$10M each) are ~500 bps lower margin but increase asset utilization between large jobs.
Source: Stifel Research, February 2026 Initiation.
Revenue Decomposition: Type of Work, Contract Mix & E-Infra End Markets
Revenue by Type of Work (FY26E)
| Type | % of Revenue |
|---|
| Non-Resi Site Development | 48% |
| Non-Resi Electrical & Mechanical | 15% |
| Paving, Roads, Runway & Bridge | 23% |
| Residential Concrete Slabs | 12% |
| Residential Plumbing | 2% |
Revenue by Contract Type
| Contract Type | % | Skew |
|---|
| Lump Sum | 49% | E-Infrastructure |
| Fixed-Unit Price | 36% | Transportation |
| Residential & Other | 15% | Building Solutions |
Both lump sum and fixed-unit price contracts enable margin upside assuming accurate estimating and strong execution.
E-Infrastructure End Market Mix
| End Market | % of E-Infra |
|---|
| Data Centers | 50% |
| Manufacturing & Semis | 23% |
| Distribution & Warehouse | 13% |
| Other Non-Resi / Fill-in | 14% |
Key Observations
- DC >30% of total STRL revenue, >50% of E-Infra. Highest-margin work within E-Infra due to complexity and scale requirements.
- Manufacturing/Semis at 23% provides CHIPS Act exposure. 7-10 year, ~$1B projects. "The early innings of semiconductor."
- E-commerce distribution backlog +150% Y/y in Q3 2025 as Amazon reinvests. Project sizes 2.0-2.5x larger than historical (EV charging adds complexity).
- Fill-in projects (~15% of E-Infra, ~$10M each) are ~500 bps lower margin but increase asset utilization between large jobs.
- Site dev is often <10% of total project costs for hyperscalers. A 5-8% price premium on site dev only marginally impacts total project cost.
Source: Stifel Research, February 2026 Initiation.
E-Infrastructure Solutions: The Growth Engine (69%)
Core thesis: As hyperscaler AI capex scales into the hundreds of billions, DC projects are evolving from data centers into data campuses. Sterling provides the critical site development + electrical infrastructure. "Remember when we were excited about the first 100-acre data center? We just started one in Texas, and the parking lot alone is 100 acres."
What Sterling Does
- Site development (legacy): Earthwork, grading, underground utilities, retention ponds, roads, duct banks. Everything below grade and site-level to prepare a pad-ready campus.
- Electrical services (CEC, acquired 2025): Exterior electrical infrastructure, duct banks, conduit, cabinets, modular/prefab electrical components. Cross-sold with site development.
- End markets: Data centers (primary), semiconductor fabrication, e-commerce distribution, pharmaceutical manufacturing, advanced manufacturing.
Why Projects Keep Getting Bigger
- DC projects spanning 3-5+ years with multiple phases. Future phase work released in packages. $1B+ future phase pipeline is tied to projects Sterling is actively working on today.
- Next generation projects will include self-power generation on campus, creating more development scope: underground water, utilities, electrical. "The amount of stuff we will touch will continue to grow."
- Semiconductor projects are 7-10 year duration (vs 3 years for DC), with total scope approaching $1B per project. "Pretty sizable for us."
TAM context: US DC construction market estimated at $48-60B in 2024/25, growing to $112-153B by 2030 (15% CAGR, Arizton/Grand View). Site development + exterior electrical (Sterling's scope) is roughly 15-20% of total DC construction cost (MEP is ~50%, building shell ~30%, site prep + civil ~20%). That implies a $10-12B addressable market today, growing to $22-30B by 2030. Sterling's $1.9B E-Infra revenue represents ~16-19% market share of the site dev + electrical TAM — dominant but not saturated. Semiconductor construction (CHIPS Act) adds another $20-30B cumulative through 2030.
Q4 2025 Performance
| Metric | Q4 2025 | Y/y | Context |
|---|
| Revenue | $521M | +123% | 67% organic growth. DC was primary growth driver. |
| Adj Op Income | — | +91% | Strong execution on large, mission-critical projects. |
| Adj Op Margin | 22.2% | Flat Y/y (legacy) | Legacy site dev ~25%. CEC in line with expectations. |
| Rocky Mtn Growth | — | +150% | Solely focused on mission-critical work. |
| CEC Revenue | — | +21% | Texas market "on fire." Modular facility tripling. |
E-Infrastructure: Key Proof Points and Upside Levers
Already Supported
- FY26 E-Infra revenue growth of +40%+ has direct management guidance. Legacy site dev +20%+ organic.
- $4.5B visibility pool ($3.01B signed + $301M unsigned + $1B+ future phase) provides 18-24 months of coverage.
- CEC cross-sell is "ahead of schedule." Cutillo expects "very nice awards" in Texas in H1 2026.
- Rocky Mountain site dev +150% Y/y. Equipment investment will drive margins higher.
- AI pilots: 15-20% incremental PM capacity. Six AI projects now underway.
What Can Add Upside Later
- Semiconductor wave: CHIPS Act projects "close to shore" and expected to award in 2026. Major phase not until ~2030. 7-10 year, ~$1B projects.
- Texas geographic expansion: Attacking from east (Plateau) and west (Rocky Mountain). CEC in Dallas center. "Unbelievable what is happening in Texas."
- Pacific Northwest: Several projects likely released 2027. Sterling moving assets/resources in 2026.
- Self-power generation on campus: Next-gen DC projects include power plants. More underground scope. Hitting ~2027-2028.
- Mechanical services: Natural progression. Being evaluated alongside geographic expansion.
- Vertical integration: Tuck-ins over next 12-18 months in new geographies. Equipment optimization in Rocky Mountain to match East Coast margins.
Takeaway: STRL works on the confirmed DC buildout plus CEC cross-sell. Semiconductor, geographic expansion, and modular/AI productivity are additive rather than required.
Transportation Solutions: The Cash Flow Backbone (20%)
Segment Overview
- FY25 Revenue: $649M (+17% Y/y). Q4 Revenue: $153M (+24%).
- Adj Op Profit Growth: +66% FY, +100%+ Q4. Strong market demand + mix towards higher margin services.
- Backlog: $1.1B (+81% Y/y). Over two years of backlog. Strong bid activity continues.
- Core markets: Rocky Mountain highway, bridges, airports, storm drainage.
- Margin: 12.2% adj op margin in Q4. Margin expansion continuing as low-bid TX heavy highway downsized.
Funding Dynamics
- Final year of current federal funding cycle (ends September 2026). Only 50-60% of total IIJA funding spent.
- "The world doesn't stop" at end of cycle. Historical pattern: extension of existing bill, adjusted for inflation.
- Good singles and doubles in awards. No single giant project, just steady flow.
FY26 Outlook
- Revenue growth: low to mid-single digits.
- Continued margin expansion as TX low-bid heavy highway winds down.
- Core Rocky Mountain market continues to see good bid activity.
Why Transportation Matters
- Steady cash flow generator: Provides ballast when E-Infra or Building cycles. Not the growth story, but the reliability story.
- Margin improvement narrative: Downsizing low-bid work in Texas is deliberate portfolio optimization. Same playbook that worked in E-Infra transformation.
- Equipment and skills transferability: Heavy equipment fleet and operators are fungible between highway and site development. Rocky Mountain resources attacking Texas from the west.
- Federal funding provides multi-year visibility. Not a toggle switch.
Key point: Transportation is not the reason to buy the stock. But it provides a steady cash flow base and the equipment/skills infrastructure that supports E-Infra geographic expansion.
Key Subsidiaries
- Texas Sterling (2001) — TX street & highway
- Wadsworth (2009) — AZ, UT, NV, CO highway & bridge
- Baniki (2011) — design-build, rail, aviation
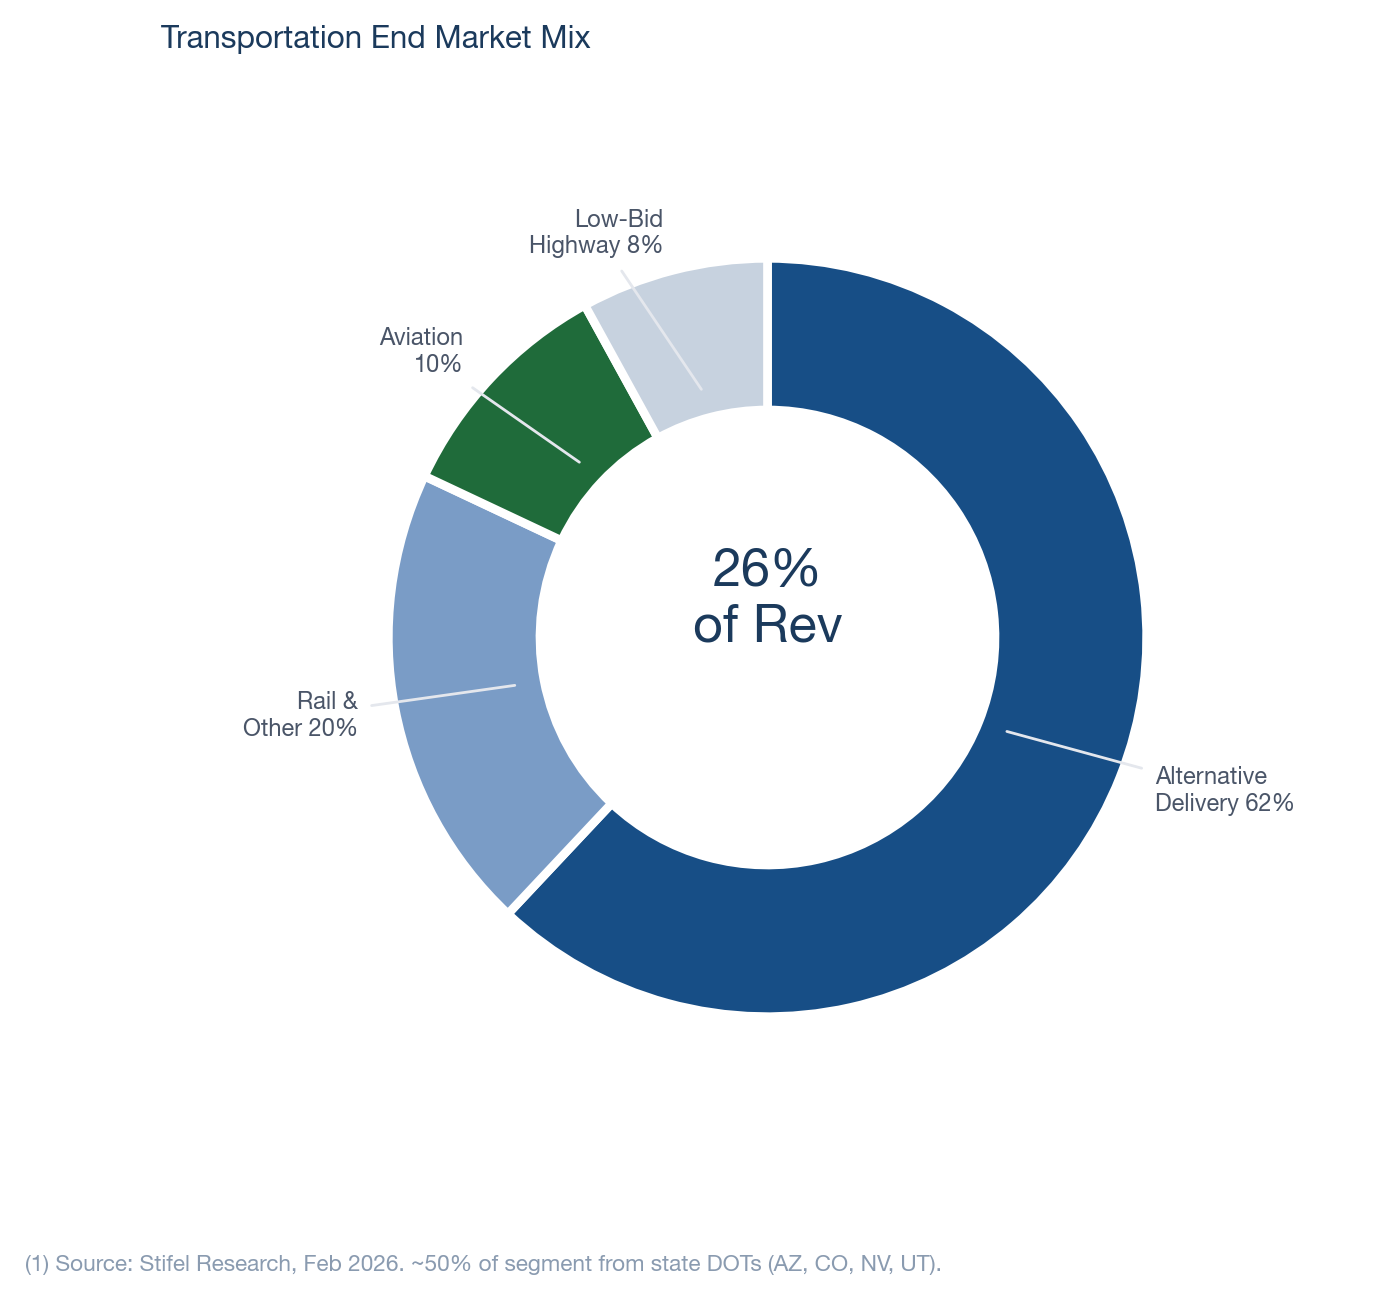
Customers & Margin Context
- State DOTs: AZ, CO, NV, UT (~50% of segment)
- Alt delivery projects with high value-add
- Aviation margins >50% higher than highway
- Rail margins >3x highway
- Low-bid heavy highway exiting TX (~$30M remaining in 2026)
Source: Stifel Research, Company Data.
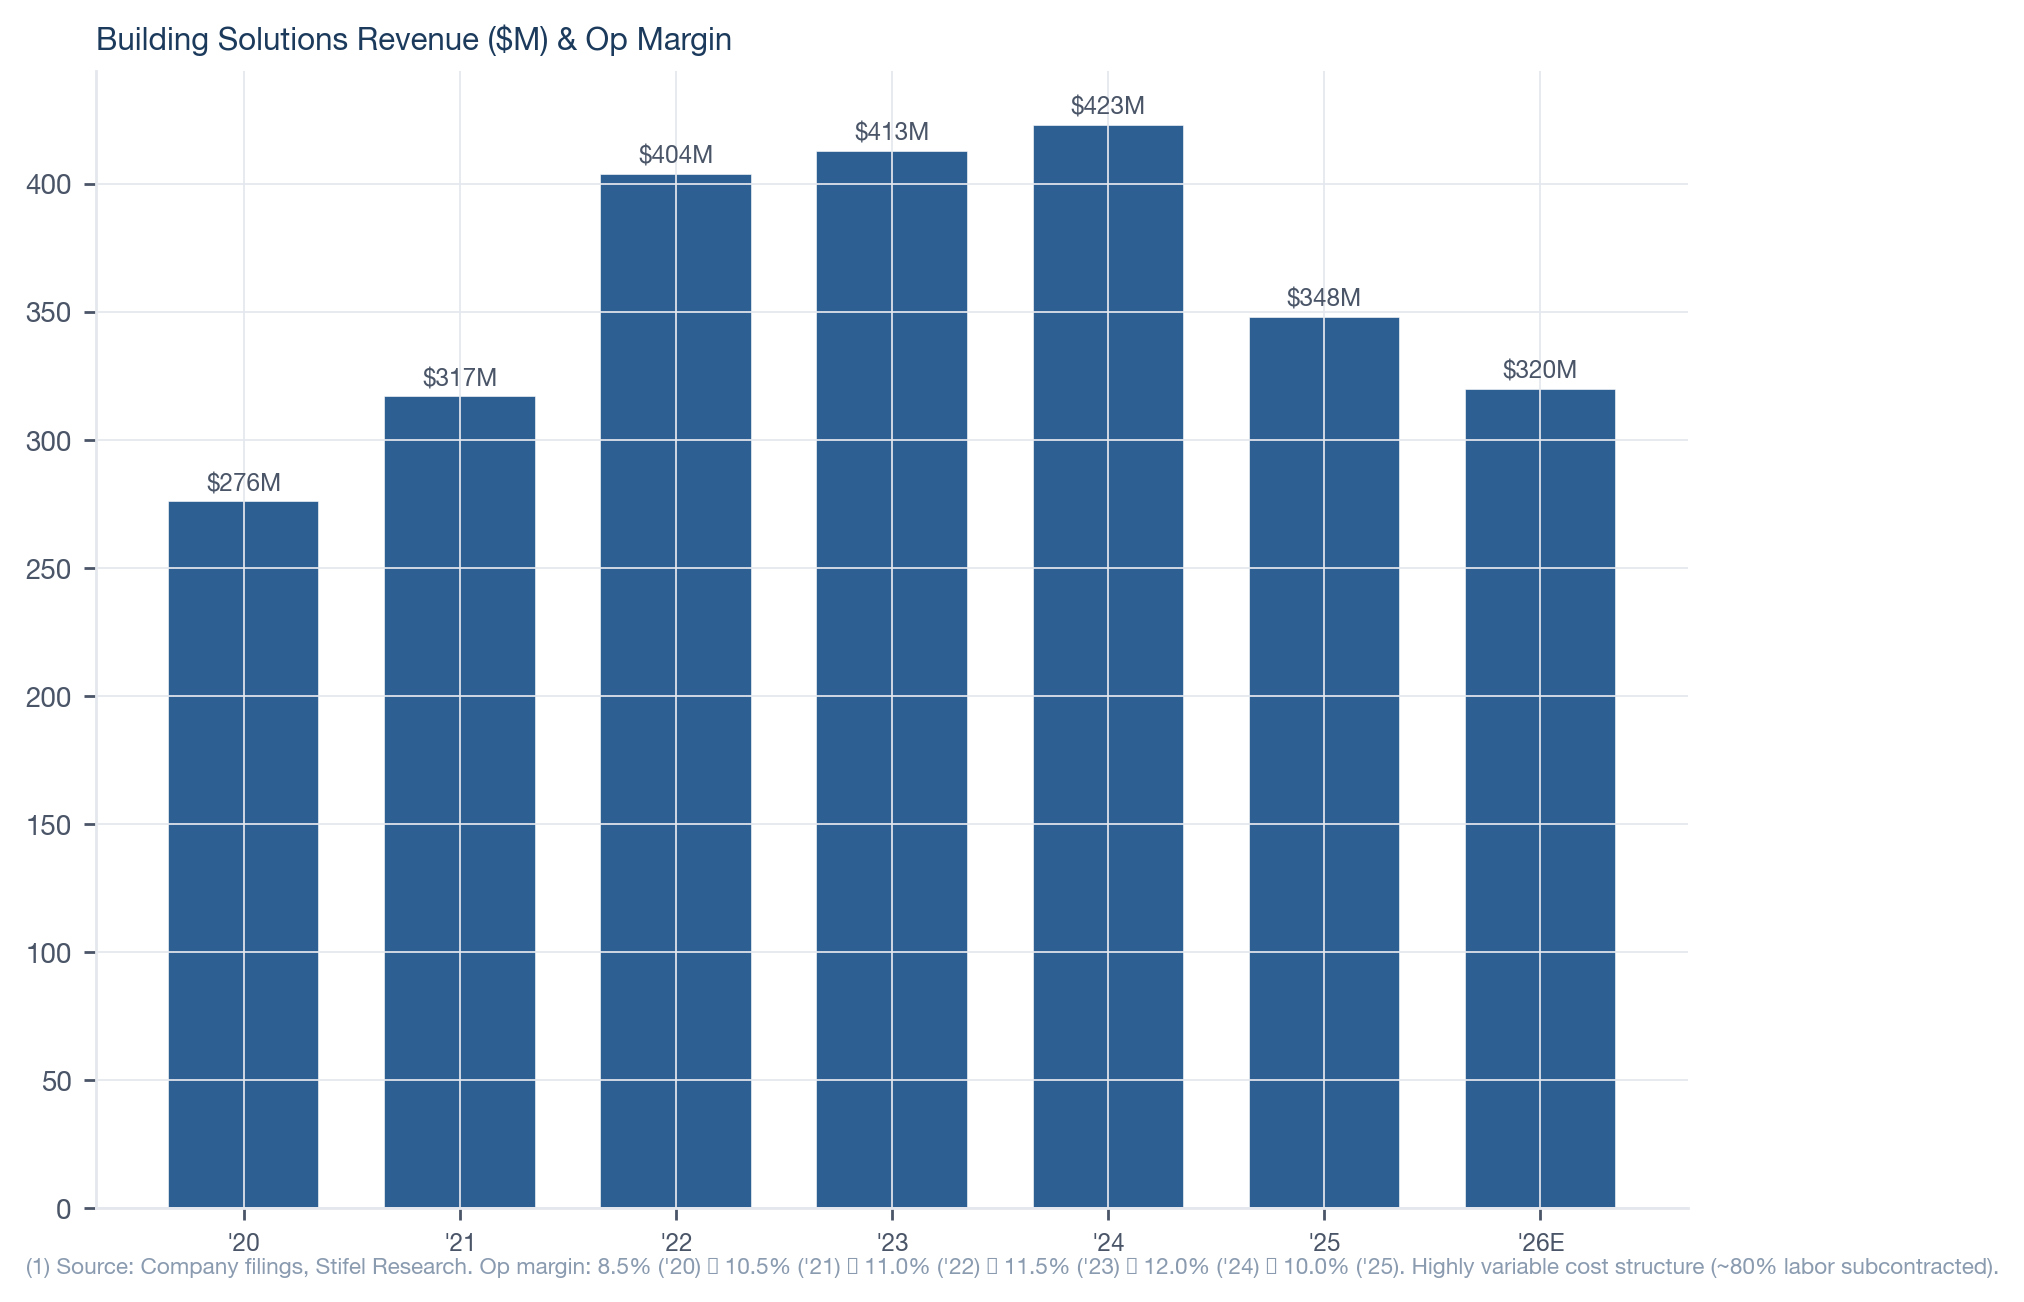
Building Solutions: Optionality (11%)
Current State
- FY25 Revenue: $348M (-6% Y/y). Q4: $82M (-9%).
- Adj Op Margin: 10.0% in Q4. Low-double-digits guided for FY26.
- Core markets: Dallas-Fort Worth, Houston, Phoenix. Residential/commercial concrete, plumbing.
- Affordability challenges suppressing new home demand. "Nothing positive happening to spark or drive the residential turnaround."
- FY26E: revenue decline high-single to low-double-digits. Tough first half 2026.
Recovery Potential
- All three key geographies (DFW, Houston, Phoenix) expected to see population growth driving new home demand over multi-year period.
- Once market turns, 3-4 months of builder inventory on ground must sell before new builds start.
- Share gain opportunity: Historical precedent with Tealstone coming out of last downturn. "We think we'll pick up significant market share coming out of this, especially in Houston and Arizona."
M&A Optionality
Cutillo on Building M&A: "If the right acquisition came along in residential, multiples are down, and by the way, their earnings are down. We'd get them at a huge discount, and we'd look really smart 18 months from now."
Why It Matters
- Not the reason to buy the stock. But also not a reason to avoid it.
- At 10-11% of revenue and declining, Building is becoming less material to the consolidated story each quarter.
- Recovery could provide incremental upside surprise. Not in any estimate.
- Potential divestiture candidate to simplify the story, though management seems inclined to hold for cyclical recovery + M&A opportunity.
Financial Impact at Consolidated Level
| Scenario | Building Rev | % of Total | Impact |
|---|
| FY26E (decline) | ~$305-320M | ~10% | Minimal drag on consolidated growth |
| Recovery (FY27+) | $370-400M | ~10% | Incremental upside, share gains |
Competitive Moat: Scale + Integration
Capability Stack
Scale Advantage3-4x larger than next competitor on large, complex DC projects. Can't replicate overnight.
Integrated OfferingSite prep + electrical = single-source for mission-critical timelines. Customers prefer one throat to choke.
Reliability Premium"If site dev is a couple weeks late, the total project delays months." Safety records + bonding capacity.
Hyperscaler RelationshipsAmazon, Meta, Google. Long-standing. Project pipelines extending 3-5 years. Repeat customer base.
Modular / AI EdgeCEC modular facility tripling. 15-20% PM capacity gain from AI. Widening gap vs smaller competitors.
Why Scale Matters in Mission-Critical Infrastructure
- These are not commodity construction jobs. Hyperscalers need contractors who can mobilize massive equipment fleets, thousands of workers, and execute on time. Reliability is worth a premium when delay costs hundreds of millions.
- Bonding capacity is a structural barrier. Smaller competitors cannot bond $500M+ projects. Sterling's balance sheet and track record provide access to project sizes others cannot touch.
- Multi-phase, multi-year projects create switching costs. Once Sterling is on site for Phase 1, they have incumbent advantage for Phases 2-5+.
Competitive Landscape
| Competitor | Focus | STRL Advantage |
|---|
| Quanta (PWR) | Electrical utility, T&D, renewable | Sterling is site dev specialist. Quanta expanding but different core competency. |
| MasTec (MTZ) | T&D, pipeline, clean energy | Sterling focused on mission-critical site dev. MasTec more diversified. |
| Comfort Systems (FIX) | Mechanical, electrical (inside building) | Sterling is exterior/site. Complementary, not directly competitive. |
| EMCOR (EME) | Mechanical, electrical services | Sterling is 3-4x larger on large complex site dev projects. |
| Regional E&C firms | Local site development | Can't bond or staff mega projects. Being acquired by Sterling (the opportunity). |
Key competitive dynamic: Regional E&C owners "see this tremendous opportunity ahead of them and they're not able to capitally fund the growth." They risk being "on the outside looking in." This is why acquisition targets are improving in quality, and why Sterling's scale advantage compounds over time.
Expert call validation (AlphaSense): An Amazon Senior Construction Manager confirmed Sterling's ability to execute complex earthwork and utility packages on 60-120 acre heavy industrial sites, noting that equipment fleet ownership ensures reliability where only a few contractors can perform. A VP of Operations at a competing firm (Ames Construction) stated that by maintaining an impeccable safety record and vast equipment resources, a contractor eliminates roughly 90% of the potential competitive field. Hyperscaler customers prioritize speed of construction and protecting reputation from safety incidents over price.
Growth Levers: PM Capacity, Warehouse Recovery & Micron Opportunity
Project Manager Capacity Pipeline
- Project managers are the binding labor constraint for STRL growth (not operators or equipment).
- Internal program recruits and trains 5+ PMs annually starting with internships. Training program lasts 4+ years.
- Adds ~$500M of annual PM capacity as program matures. PMs manage $100M+ projects after completion.
- Also: Sterling Academy (Transportation), CEC University (electrical), Plateau training school (site dev).
- AI tools expanding PM capacity by 15-20%. Larger projects also help: one PM on a $500M campus vs. five PMs on five $100M jobs.
E-Commerce / Warehouse Recovery
- Warehouse spending moderated post-COVID but bottoming on Amazon reinvestment.
- E-commerce distribution backlog +150% Y/y in Q3 2025.
- Project sizes now 2.0-2.5x larger than historical. EV charging infrastructure adds scope and complexity.
- HSD% of revenue mix and growing. Not in consensus estimates as a growth driver.
Micron Opportunity in New York
Micron's ~$100B semiconductor fab project in central New York. Petillo is well positioned for site development given its Northeast presence. Only the tree-clear contractor has been awarded so far. Site development award could come in H1 2026. Project spans ~7-10 year timeframe. Even if STRL doesn't win, industry capacity tightens, which indirectly benefits STRL.
Asset Repurposing Optionality
- Yellow iron from Transportation can be repurposed for E-Infrastructure site dev work. Already winning DC projects in Rocky Mountain via this approach.
- Traveling crews from Building Solutions commercial work can do duct bank concrete for DC projects.
- Accelerates mix shift toward higher-margin E-Infra without incremental capex.
Cycle Diversification
- Residential: early/mid-cycle performer
- Private non-resi: mid/late-cycle performer
- Public (Transportation): late-cycle / recession resilient
- Diversification across all three dampens overall cyclicality, supporting a premium multiple.
Source: Stifel Research, February 2026 Initiation; STRL Q4 2025 Earnings Call.
Market Context: Data Center Infrastructure — A $300B+ Construction Cycle
Hyperscaler CapEx Is Accelerating, Not Decelerating
| Company | 2024 CapEx | 2025 CapEx | 2026E CapEx | Y/y |
|---|
| Amazon | $75B | ~$100B | $200B | +100% |
| Alphabet | $52B | $75B | $175-185B | +140% |
| Microsoft | $56B | $80B | ~$120B | +50% |
| Meta | $37B | $60B | $115-135B | +108% |
| Oracle | — | — | $50B | — |
| Combined | $224B | $413B | $600-700B | +55-70% |
Sources: Company guidance (Q4 2025 earnings), Motley Fool, Data Center Dynamics, Commonfund. March 2026.
DC Construction Market Sizing
| Metric | Value |
|---|
| Global DC Construction (2025) | $275B |
| US DC Construction (2025) | $59.5B |
| Global DC Construction (2030E) | $456B+ |
| CAGR (2025-2030) | 12-15% |
| US Share of Global | ~22% |
Sources: Fortune Business Insights, GM Insights, Research & Markets. Dec 2025 – Mar 2026.
Key point for STRL: Hyperscaler CapEx is heavily weighted toward new campus construction (site prep, infrastructure, electrical), not just server purchases. A $200B Amazon CapEx year means dozens of new campuses, each requiring Sterling's exact services.
Market Context: Stifel DC Project Tracker — Pipeline +170% Y/y, Texas +865%
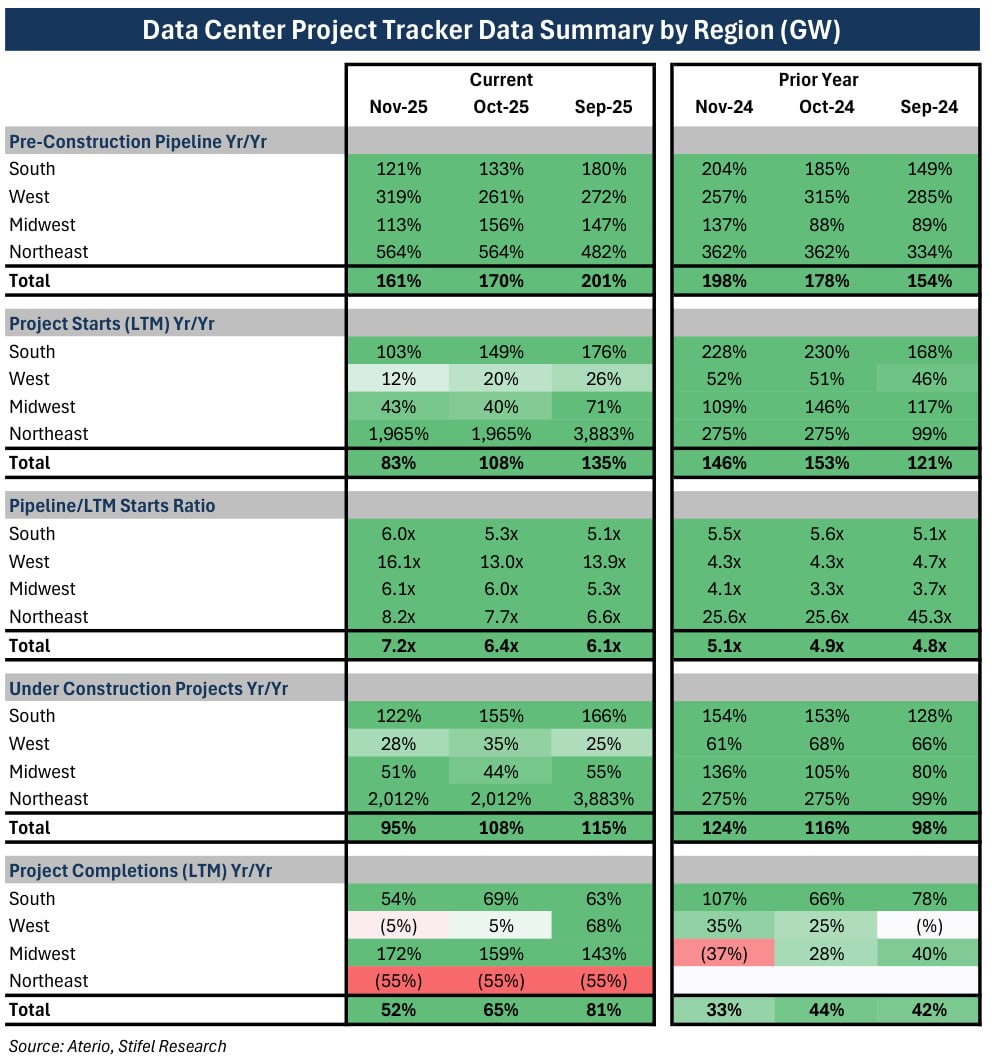
Source: Stifel Research / Aterio, November 2025. "Data Center Project Tracker: Texas Seeing Notable Relative Strength."
Key Data Points
| Metric (Oct-25) | Y/y |
|---|
| Pre-Construction Pipeline | +170% |
| Pipeline (GW) | 173.4 GW (vs 64.3) |
| Project Starts (LTM) | +84% |
| Under Construction | +87% |
| Pipeline / LTM Starts | 6.7x (healthy) |
| High Probability Pipeline | ~60% |
| Early Site Dev Phase | ~45% of UC |
STRL-Relevant State Data
| State | Pipeline Y/y | Pipe/Starts |
|---|
| Texas | +865% | 5.8x |
| Georgia | +232% | 13.3x |
| Virginia | +12% | 7.1x |
| Arizona | +238% | 8.7x |
Direct STRL read-through: ~45% of projects under construction are in early site development phase, which is Sterling's exact scope. Texas pipeline +865% Y/y aligns with Cutillo's forecast that TX becomes STRL's #1 market. Georgia (STRL stronghold) has 13.3x pipeline/starts ratio, the healthiest in the country.
Market Context: Time-to-Power Crisis & Construction Bottlenecks
The "Time-to-Power" Constraint
- Power constraints extend DC construction timelines by 24-72 months (WRI analysis). This is the #1 bottleneck for hyperscaler expansion.
- ERCOT (Texas) large-load interconnection pipeline: 200GW+ of requested load. Texas is the #1 target market.
- Q4 2025: developers added only 25 GW of new capacity to pipeline (half of prior quarter), signaling grid limits.
- Microsoft built 2 GW globally in 2025 alone. Plans 1.5 GW single site in Wisconsin. Acknowledged turning away customers due to power shortages.
- Self-power generation on DC campuses is the emerging solution. Sterling is already preparing for this (underground infrastructure for on-site power plants).
Why This Benefits Sterling Specifically
- Campuses are getting bigger: 50 acres (2018) → 1,000+ acres (2025). Bigger = more site prep scope = more Sterling revenue per project.
- Complexity is increasing: Self-power, underground utilities, duct banks, conduit. More infrastructure scope per campus.
- Speed premium is rising: When power delays stretch 2-5 years, the site prep contractor who can execute fast and reliably commands pricing power.
- Texas expansion: Sterling is actively deploying into the #1 US DC market. Cutillo: "Texas to become our #1 market within 5 years."
Semiconductor Wave (CHIPS Act)
- $52.7B in CHIPS Act subsidies + $39B manufacturing incentives driving fab construction.
- 7-10 year, ~$1B projects. "The early innings of semiconductor."
- Sterling's site prep for fabs uses identical capabilities as DC work (fungibility moat).
Structural demand thesis: This is not a 2-3 year capex cycle. Hyperscaler CapEx commitments run through 2028-2030. Campus sizes are expanding. Power constraints are creating multi-year queues. CHIPS Act adds a parallel demand wave in semiconductor. Sterling sits at the intersection of all three trends with a capacity-constrained competitive position.
Financial Summary — Operating Model, Balance Sheet and Returns
| ($M except per share) |
FY 2023 |
FY 2024 |
FY 2025 |
Q4 2025 |
FY 2026E Guide |
FY 2027E |
FY 2028E |
| Income Statement |
| Revenue | $1,972 | $2,116 | $2,490 | $756 | $3,050-3,200 | $3,211 | ~$3,500 |
| Y/y Growth | +11.5% | +7.3% | +32% | +69% | ~+25% | +3.4% | ~+9% |
| Gross Profit | $338 | $426 | $572 | — | ~$730 | ~$706 | ~$770 |
| Gross Margin | 17.1% | 20.1% | 23.0% | — | 23.5% | 22.0% | 22.0% |
| Adj EBITDA | $260 | $344 | $504 | $142 | $626-659 | $592 | ~$640 |
| EBITDA Margin | 13.2% | 16.2% | 20.2% | 18.8% | 20.5% | 18.4% | 18.3% |
| Adj Diluted EPS | $4.44 | $7.09 | $10.88 | $3.08 | $13.45-14.05 | $14.71 | ~$16.00 |
| Y/y Growth | — | +59.7% | +53.5% | +78% | +27% | +6.4% | ~+9% |
| Shares (diluted) | 31.2M | 31.1M | 30.9M | — | ~30.6M | ~30.6M | ~30.6M |
| Cash Flow & Balance Sheet |
| Operating Cash Flow | — | $360 | $440 | $186 | ~$530 | ~$475 | ~$510 |
| Capex (% Rev) | — | — | $77 (3.1%) | — | $100-110 | ~$100 | ~$105 |
| Free Cash Flow | — | — | ~$363 | — | ~$425 | ~$375 | ~$405 |
| Cash / Debt | — | — | $391 / $291 | — | Net cash | — | — |
| Net Debt / EBITDA | — | — | -0.19x | — | ~-0.3x | — | — |
| Returns |
| ROIC | — | ~18% | ~22% | — | ~24% | — | — |
| ROE | — | ~25% | ~30% | — | ~32% | — | — |
Quality KPIs
FY25 Adj EBITDA Margin21.3%Exceeded 20% for first time ever
5-Yr EPS CAGR35%+5th consecutive year of 35%+ Adj EPS growth
Book-to-Burn1.64xQ4 2025. Signed backlog. Demand durability.
OCF / EBITDA~83%$440M / $531M. Conservative 80%+ guided for FY26.
Sources: Q4 2025 earnings call, company reports. FY23 and FY24 from 10-K. FY26E from company guidance (midpoints represent +25% rev, +26% adj EPS, +28% adj EBITDA).
FCF Conversion & Peer Positioning: Specialty, Not Civil
Specialty Peers (Strong FCF + DC Exposure)
| Company | FCF Conv | NTM EV/EBITDA | DC Mix |
|---|
| FIX (Comfort Systems) | ~75% | 30.3x | ~30% |
| STRL (Sterling) | ~70% | 23.3x | >30% |
| AGX (Argan) | ~72% | 29.0x | High indirect |
| EME (EMCOR) | ~68% | 19.1x | ~25% |
| LGN (Legence) | ~53% | 18.5x | ~30% |
| PWR (Quanta) | ~54% | 26.1x | High indirect |
| Specialty Avg | ~64% | 24.6x | — |
Civil Peers (Lower FCF, No DC)
| Company | FCF Conv | NTM EV/EBITDA |
|---|
| ROAD (Construction Partners) | ~46% | 17.4x |
| GVA (Granite) | ~53% | 11.1x |
| KNF (Knife River) | ~33% | 10.7x |
| CDNL (Cardinal Infra) | ~53% | 10.1x |
| Civil Avg | ~46% | 12.3x |
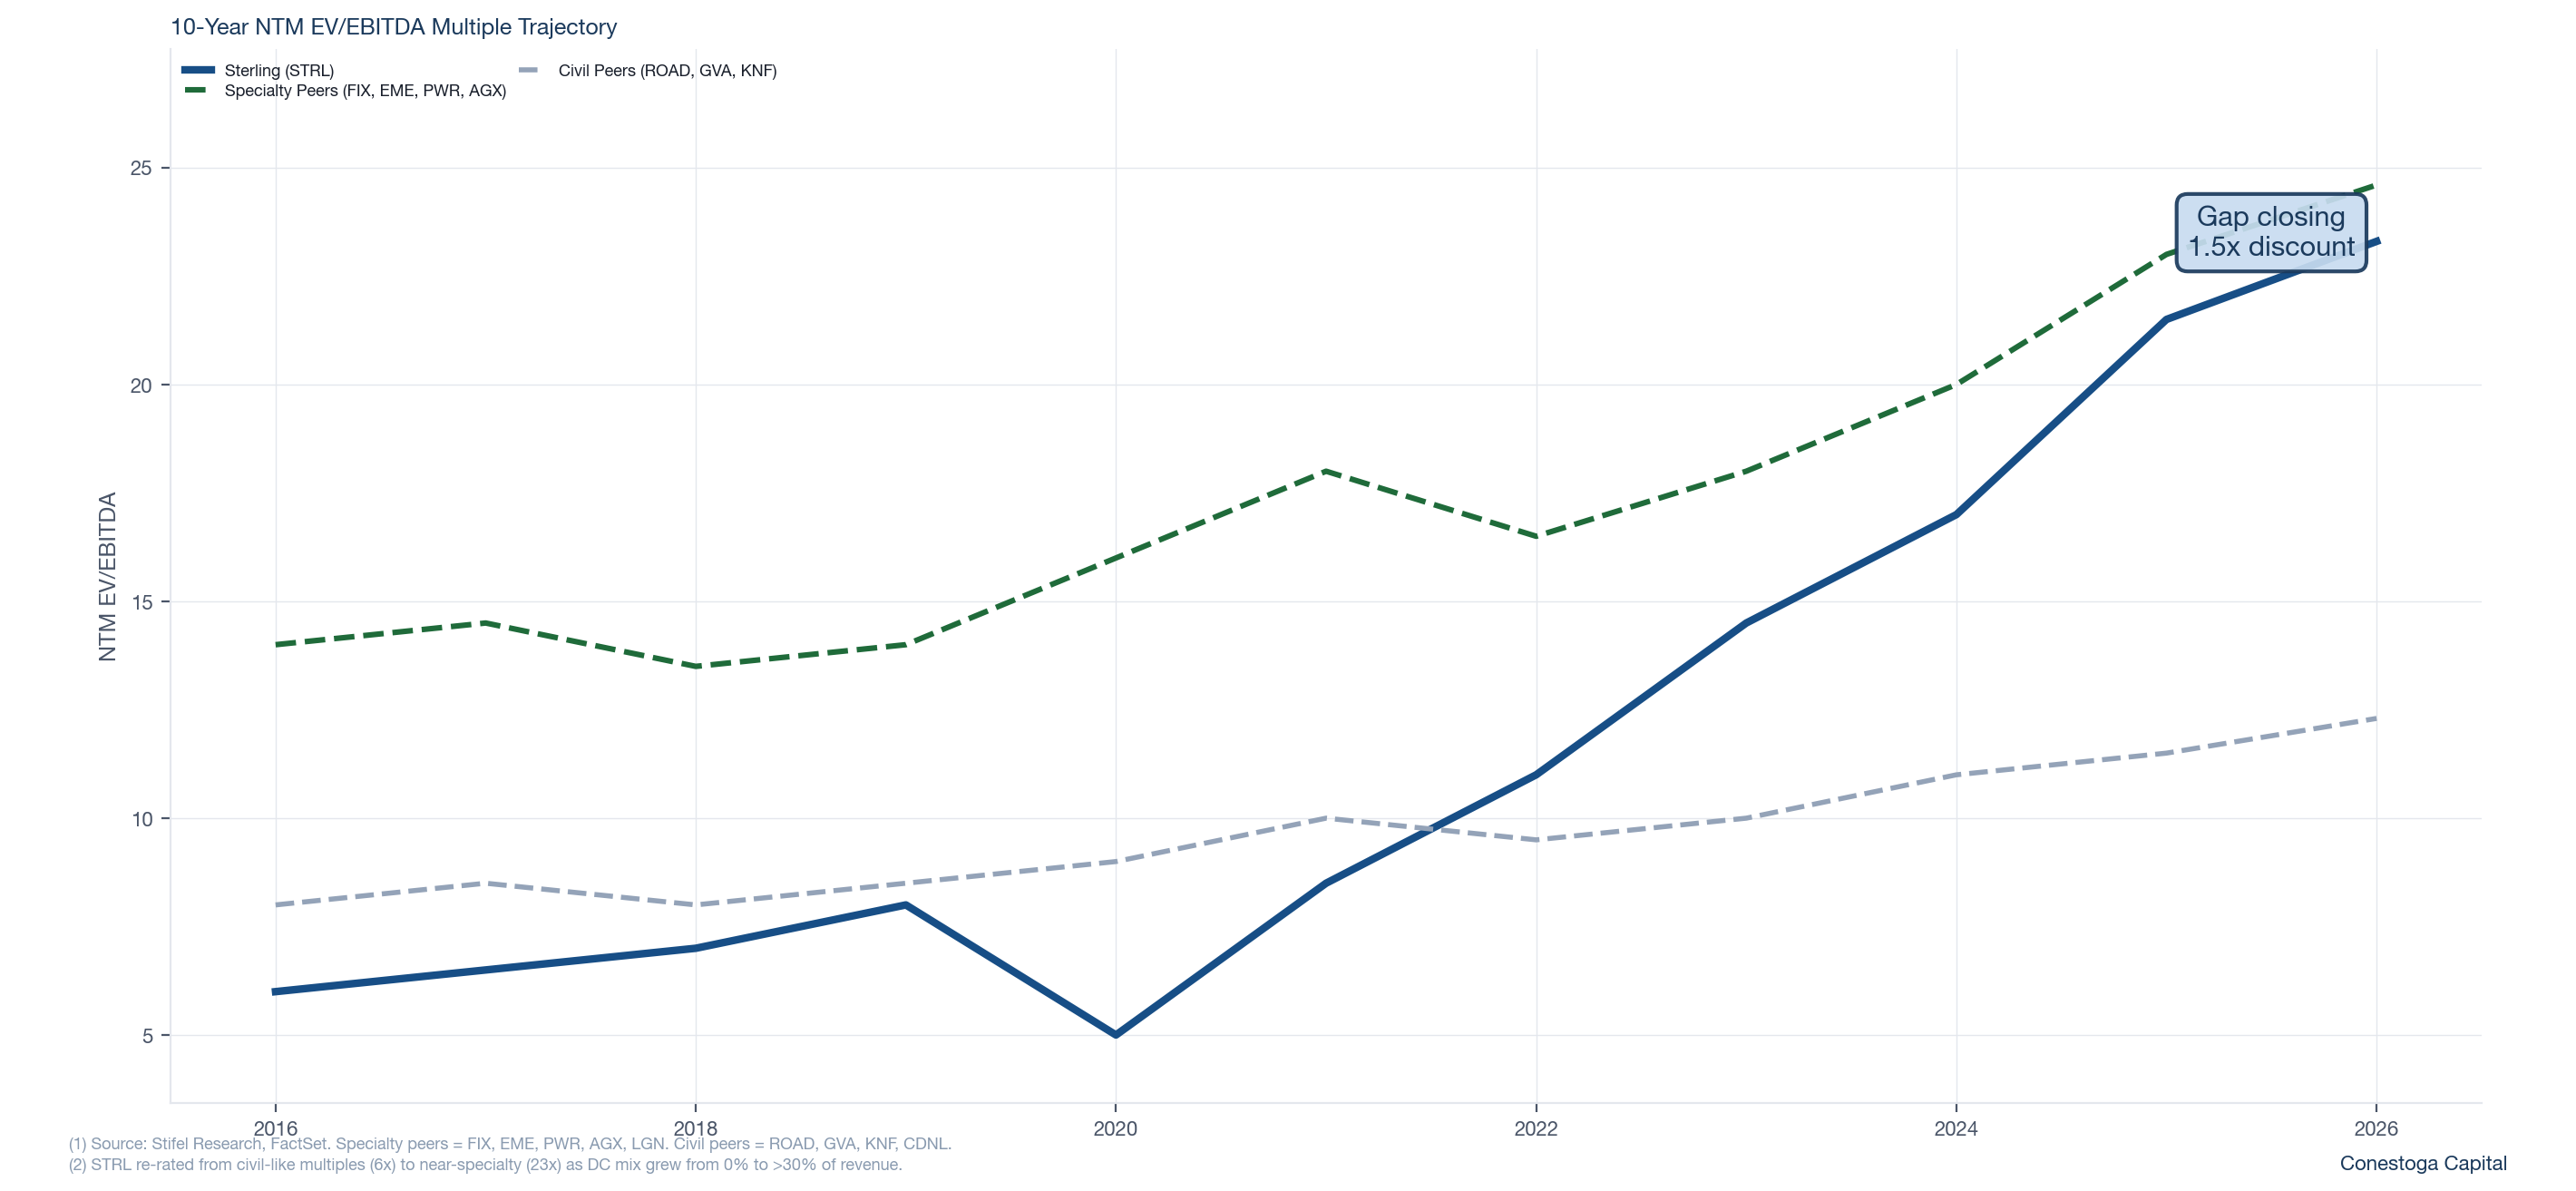
The Valuation Argument
STRL's type of work resembles civil peers (site development, earthmoving), but its FCF conversion (~70% of EBITDA) and data center exposure (>30% of revenue) align it firmly with specialty E&C peers. The market is gradually recognizing this.
- Specialty peer average: 24.6x NTM EV/EBITDA
- Civil peer average: 12.3x NTM EV/EBITDA
- STRL current: 23.3x (1.5-turn discount to specialty avg)
- Gap to best-in-class: ~7x turns (FIX at 30.3x)
- Stifel: "We see a path for the multiple to converge with specialty peers over time"
Why FCF Conversion Matters
- STRL expects operating income ≈ cash from operations (minimal working capital drag)
- FCF conversion in mid-60% of EBITDA range, among best-in-class specialty E&C
- Transportation and Building Solutions have particularly favorable working capital profiles
- Building Solutions: <$1M annual capex, ~15-day cash cycles
- Strong FCF supports dual capital deployment: buyback ($374M remaining) + accretive M&A
Source: Stifel Research, FactSet. February 2026 Initiation.
Margin Expansion: Path to 25%+
EBITDA Margin trajectory: 13.2% (FY23) ➜ 15.1% (FY24) ➜ 21.3% (FY25) ➜ 20.5-20.6% (FY26E). E-Infra adj op margin: 22.2% (Q4), ~25% (FY legacy site dev). CEC margins improving as DC mix shift accelerates.
Drivers of Margin Expansion
| # | Driver | Mechanism | Status / Timeline |
|---|
| 1 | Mix Shift to E-Infra | Biggest segment is highest margin. As E-Infra grows to 70%+ of revenue, consolidated margins rise. Large, mission-critical projects carry premium margins. | In progress. E-Infra was 69% of Q4 rev vs 56% in FY24. |
| 2 | CEC Cross-Sell | Combined site + electrical eliminates subcontractor markup and improves scheduling efficiency. Small dry utility acquisition in Georgia already showing "significant margin improvements." | Ahead of schedule. Joint TX awards expected H1 2026. |
| 3 | CEC Modular Build | Tripling modular facility to 300k sqft. Pre-building components in factory reduces field electricians needed, improves productivity. "Insignificant capex, significant capacity/margin impact." | Underway. Lease signed. Impact H2 2026+. |
| 4 | Rocky Mountain Equipment | Currently using converted highway assets. Investing in purpose-built equipment suite to match East Coast operations. Same pricing, just lower cost to execute. | FY26 capex increase. $100-110M vs $77M. |
| 5 | Transportation Mix | Downsizing low-bid TX heavy highway. Focus on higher-margin Rocky Mountain core. FY25 adj op profit +66% on only +17% revenue growth. | In progress. Continued expansion in FY26. |
FY26 Margin Guidance
- E-Infra adj op margins: 23-24% range (FY26E). Legacy site dev ~25%. Room for CEC to improve as DC mix increases and combined projects ramp.
- Transportation: Continued margin expansion as TX low-bid work runs off.
- Building: Low double-digit adj op margins despite revenue decline. Cost discipline holding.
- Consolidated EBITDA margin: ~20.5% guided. Slight dip from 21.3% driven by CEC acquisition mix (lower initial margins) and geographic expansion startup costs. Expected to re-accelerate.
Revenue Algorithm: From $2.5B to $4B+
The bridge does not require heroic assumptions. It needs continued DC demand, CEC cross-sell execution, and geographic expansion. Semiconductor is option value, not in the base case.
FY25A ➜ FY26E Segment Bridge
| Segment |
FY25A |
FY26E Mid |
Growth |
Assumption |
| E-Infrastructure | $1,889M | ~$2,645M | +40% | Guided +40%+. DC demand + CEC + geo expansion. |
| Transportation | $649M | ~$670M | +3% | Low-mid single digits. Core Rocky Mtn growth. |
| Building | $348M | ~$310M | -11% | HSD-LDD decline. Tough first half. |
| Total | $2,490M | ~$3,125M | +25% | Guided $3,050-3,200M. |
What Is In the Base Case vs. What Is Not
In the Base Case (FY26E Guidance)
- Continued DC demand from existing hyperscaler relationships with 3-5 year pipelines
- CEC revenue growth from TX data center market strength
- Legacy E-Infra organic growth +20%+ from backlog execution
- Rocky Mountain continued ramp on mission-critical work
- Transportation steady in core Rocky Mountain markets
- Building decline due to residential weakness
Option Value (Not in FY26E Numbers)
- Semiconductor awards: "close to shore" but major phase not until ~2030
- Pacific Northwest entry: assets moving in 2026, projects likely 2027
- Ohio/Indiana market: potential but not on 10-yard line
- Self-power generation scope on next-gen DC campuses (~2027-2028)
- Building Solutions recovery and share gains
- Mechanical services expansion (natural progression)
- Tuck-in acquisitions at depressed multiples
Key point: The stock can work from here on confirmed growth drivers and the existing visibility pool. The option-value lanes (semi, new geographies, building recovery, mechanical) provide asymmetric upside if they hit.
Comparable Companies — Bloomberg Analyst-Curated Comps
| Company | Mkt Cap | 2Y Corr | BF P/E | BF EV/EBITDA | BF EV/EBIT | BF EV/Rev |
|---|
| Sterling (STRL) | $11.7B | — | 27.0x | 17.7x | 21.2x | 3.7x |
| Comfort Systems (FIX) | $45.1B | 0.78 | 33.2x | 23.2x | 25.2x | 3.9x |
| EMCOR Group (EME) | $31.4B | 0.77 | 24.2x | 15.6x | 17.2x | 1.7x |
| Quanta Services (PWR) | $79.8B | 0.74 | 39.2x | 24.1x | 37.7x | 2.5x |
| MasTec (MTZ) | $24.2B | 0.73 | 33.8x | 17.2x | 25.6x | 1.5x |
| IES Holdings (IESC) | $9.0B | 0.71 | 23.9x | 17.4x | 20.0x | 2.0x |
| Dycom (DY) | $9.8B | 0.57 | 24.0x | 12.2x | 20.7x | 1.7x |
| Primoris (PRIM) | $7.3B | 0.72 | 22.0x | 12.4x | 15.5x | 0.9x |
| Group Mean | $21.6B | — | 23.4x | 13.5x | 18.2x | 1.9x |
| STRL Premium to Mean | — | — | +16% | +31% | +17% | +91% |
Source: Bloomberg Analyst-Curated Comps, BBG Prep & Rep EW TR Index, March 30, 2026. BF = Best Forward consensus estimates.
Key takeaway: STRL trades at a +31% premium to comp group on BF EV/EBITDA (17.7x vs 13.5x mean). Premium is justified by: 67% organic E-Infra growth, 20%+ EBITDA margins, net cash balance sheet, and mission-critical moat with multi-year visibility. Within the group, only FIX (23.2x) and PWR (24.1x) trade at higher EBITDA multiples — both are best-in-class specialty E&C with similar DC exposure profiles.
Valuation — Forward Multiples & Target Framework
STRL Forward Valuation
| Period | Adj. EBITDA | EV/EBITDA | EV/Sales |
|---|
| FY26E | $642M | 18.9x | 3.9x |
| NTM | ~$620M | ~19.5x | ~3.8x |
| FY27E | $592M | 20.4x | 3.8x |
| FY28E | ~$640M | 18.9x | 3.5x |
EBITDA CAGR (FY25-FY28E): ~8.3%. Anchor: ~20x NTM EV/EBITDA. PT avg: $489 (+25% upside).
Target Price Framework
| Scenario | Multiple | EBITDA | Target | Upside |
|---|
| Base | 20x | ~$620M | $438 | +12% |
| Bull | 24x | ~$620M | $521 | +33% |
| Bull+ | 27x | ~$620M | $582 | +48% |
| Bear | 16x | ~$620M | $355 | -9% |
NTM EBITDA ~$620M, ~$100M net cash, ~30.6M diluted shares. Bull = sustained E-Infra premium; bear = DC demand normalizes.
Supplemental Valuation KPIs
EV / Sales3.9x ➜ 3.5xFY26E to FY28E
EV / EBITDA18.9x ➜ 18.9xFY26E to FY28E (growth digests premium)
P / FCF28.3x ➜ 29.7xFY26E to FY28E
FCF Yield3.5% ➜ 3.4%FY26E to FY28E as conversion stays strong
Valuation context: At roughly ~20x NTM EV / Adj. EBITDA, STRL trades at a premium to the E&C median (15x) but has far superior growth (32% rev, 53% EPS vs 9% median). The premium is justified by 67% organic E-Infra growth, $4.5B visibility pool, net cash, and a mission-critical moat. 7 analysts, all Buy-rated. Average PT (where disclosed): $489 (+25% upside). Coverage expanded from 4 to 7 analysts in last 12 months.
Valuation Detail: Precedent M&A & Analyst Methodology
Precedent M&A Transactions
| Acquirer | Target | Year | Implied EV/EBITDA |
|---|
| STRL | CEC Facilities Group | 2025 | ~9.6x |
| EME | Miller Electric | 2025 | ~10.8x |
| PWR | Cupertino Electric | 2024 | ~9.3x |
| FIX | Walker Engineering | 2019 | ~8.6x |
| STRL | Plateau Excavation | 2022 | ~5.6x |
| STRL | Petillo Inc. | 2020 | ~5.0x |
STRL equity trades at low-20s NTM EV/EBITDA. Acquiring specialty contractors at mid-to-high single-digit multiples = highly accretive multiple arbitrage. Source: DA Davidson, AlphaSense.
Analyst Valuation Methodology
| Broker | PT | Methodology |
|---|
| Sidoti | $505 | 32x 2027E EPS ($15.78) = ~20x 2027E EBITDA ($768M). Argues re-rate toward high end of E&C peers. |
| DA Davidson | $500 | 24x/21x 2026/2027 EBITDA. CEC aligns with premium sub-group (FIX, EME, PWR). |
| Stifel | $490 | 1.5-turn EBITDA discount to specialty peers, 4-turn to best-in-class. Gap closes as TX highway exits. |
| Blair | OP | 18-20x 2027E EBITDA. DC revenue to $977M by 2030. Direct DC/AI infrastructure vehicle. |
| Thompson Davis | Buy | CEC modular expansion + Building Solutions M&A at depressed multiples. |
| Texas Capital | Buy | Regional coverage. Semiconductor TAM (CHIPS Act pipeline). |
| Cantor Fitz | Buy | Fourth leg expansion (mechanical), self-power generation scope. |
M&A arbitrage: STRL consistently acquires at 5-10x EBITDA while its own equity trades at 18-20x. Each deal is accretive from day one. The CEC deal at 9.6x aligns with the multiples peers like EME, PWR, and FIX pay for specialty electrical assets, confirming STRL is now competing in the same premium arena.
Catalysts & Monitoring
Near-Term Catalysts (0-6 months)
- Texas joint awards (H1 2026): Cutillo expects "very nice awards" in TX for combined site dev + CEC. First proof point of cross-sell thesis.
- Q1/Q2 2026 earnings: Confirm E-Infra +40%+ revenue growth trajectory and margin progression.
- CEC modular facility ramp: 300k sqft facility leased. Production scaling. Margin impact H2 2026.
- Semiconductor awards: Some CHIPS Act projects "close to shore" for 2026 award. Confirm next wave timing.
- Backlog growth: Book-to-burn above 1.0x confirms demand durability. Watch combined backlog progression.
Medium-Term Catalysts (6-18 months)
- Pacific Northwest entry: Assets/resources moving in 2026. Project awards likely 2027.
- Federal highway reauthorization: Current cycle ends September 2026. Extension or new bill provides Transportation visibility.
- Building Solutions inflection: Interest rate relief could spark residential recovery. Share gains from cyclical consolidation.
- Tuck-in acquisitions: More quality targets in market. Geographic + capability expansion at attractive multiples.
Longer-Term Catalysts (18+ months)
- Semiconductor mega-projects (~2027-2030): 7-10 year, ~$1B projects. "The early innings of semiconductor."
- Self-power generation on DC campuses: Next-gen projects include power plants. More underground scope. 2027-2028.
- Mechanical services expansion: Natural progression from site dev + electrical. Being evaluated.
- Revenue crossing $4B+: Could trigger broader institutional ownership.
Key Monitoring Metrics
| Metric | Good Read | Bad Read |
|---|
| E-Infra Growth | Stays 30%+ with healthy organic | Narrows below 20% |
| Book-to-Burn | Above 1.0x; backlog expanding | Below 1.0x; awards slowing |
| E-Infra Margins | 23-24%+ with CEC accretion | Stalls below 22% |
| TX Joint Awards | Named wins in H1 2026 | Delayed or vague |
| Guidance Quality | Beat-and-raise cadence | Guide flattens or narrows |
| DC Concentration | Diversifying into semi, e-comm | Avoids sizing; all DC |
Risks & Watch Items
| # | Risk | Why It Matters | What to Watch |
|---|
| 1 | DC Cycle Duration | If DC buildout is a 2-3 year phenomenon rather than structural, the multiple compresses 35-50%. The solar over-ordering parallel is the bear case. | Hyperscaler capex announcements staying elevated. Backlog duration extending. Future phase pipeline growing. |
| 2 | Hyperscaler Capex Slowdown | Sterling's E-Infra demand is directly tied to hyperscaler capital deployment programs. A 20-30% capex cut would impact the order book. | Quarterly commentary on customer capital deployment plans. Book-to-burn ratios. Award activity in new geographies. |
| 3 | Customer Concentration | DC subset of E-Infra is the largest component but exact % is not disclosed. Top customer concentration is unstated. | Management commentary on customer diversification. New customer wins. Semiconductor and e-commerce contribution growing. |
| 4 | CEC Integration | Cross-sell thesis is "ahead of schedule" but joint awards are not yet announced. Integration of acquisition + geographic expansion simultaneously adds execution risk. | Named combined site + electrical wins in TX. CEC margin trajectory. Modular facility production ramp. |
| 5 | Valuation | At ~27x FY26E P/E and ~22x EV/EBITDA, the stock prices in durable growth. If growth normalizes to 15-20%, multiple compresses to 15-20x = significant downside. | NTM estimates holding. Beat-and-raise cadence. Multiple sustained on real growth, not narrative. |
| 6 | Building Solutions | Declining segment with affordability headwinds. Not the thesis, but a drag on consolidated growth and a distraction from the E-Infra story. | Revenue stabilization. Interest rate trajectory. Tuck-in M&A at depressed multiples for recovery upside. |
| 7 | New Geo Margin Dilution | New geographic expansion (Texas, Pacific NW) starts at lower margins. Equipment conversion and ramp take time. | Rocky Mountain margin improvement from equipment investment. TX margin converging to East Coast levels. |
| 8 | Labor Constraints | "If I had another 1,000 electricians in Texas, I could put them to work in 30 days or less." Tight labor limits growth rate. | Modular build adoption reducing field labor needs. AI tools expanding PM capacity. Acquisition as labor acquisition. |
Price Context & Positioning — Setup Into Next Catalysts
Price History
| Period | Price | Return | Context |
|---|
| 2020 Lows | ~$10-15 | — | Pre-transformation. Money-losing highway contractor. |
| Mar 2025 (tariff lows) | $105 | — | 52-week low. Broader market selloff, tariff fears. |
| Sep 2025 | $367 | +250% from lows | CEC acquisition transforming the business. |
| Feb 2026 (post-Q4) | $460 | +25% in 1 month | Record Q4 results. E-Infra +123%. Record backlog. |
| Current (Mar 30, 2026) | $392.26 | +247% 1Y | Consolidation ~15% off highs. Fundamentals stronger than ever. |
Technical Summary
- 52-Week Range: $104.96 – $459.72
- YTD 2026: +32% (from ~$297)
- 1-Year Return: +247% (from ~$113)
- 2-Year Return: +700%+
- RSI (14D): ~48 (neutral; not overbought)
- Beta: ~1.35
- 30D Volatility: ~45%
- 90D Volatility: ~52%
Entry point assessment: The stock has pulled back ~15% from the $460 post-Q4 highs, creating a more attractive entry. RSI at ~48 is neutral. The 1Y move from $105 to $392 reflects a fundamentally transformed business (5th year of 35%+ EPS growth, record backlog, CEC integrated), not just multiple expansion. Current ~29x FY26E P/E is reasonable for a 25%+ EPS grower with $4.5B of visibility.
Sell-Side Consensus
- 7 analysts covering, all Buy-rated. Average PT (where disclosed): $489 (+25% upside). Coverage expanded from 4 to 7 in last 12 months.
- William Blair (Louie DiPalma): Outperform. "Even after tenfold increase since 2020, just getting started." Projects DC revenue $977M by 2030. 18x 2027E EBITDA.
- Stifel (Brian Brophy): Buy, $490 PT. Initiation Feb 2026. Positive on Texas whitespace. VP IR Noelle Dilts is former Stifel E&C analyst.
- DA Davidson (Brent Thielman): Buy, $460 PT (raised from $355). CEC adds specialty electrical. Houston mgmt update positive.
- Sidoti (Julio Romero): Buy, $505 PT (highest). "Execution at scale continues to resonate with larger, mission-critical projects."
STRL | High-Quality New Idea Candidate
STRL has transformed from a money-losing highway contractor into a $14B DC infrastructure platform. The combination of secular demand (data centers, semiconductor, reshoring), a rare scale advantage (3-4x larger than competitors on mega projects), and an integrated site dev + electrical offering creates a compelling compounder profile. The business just delivered its 5th consecutive year of 35%+ EPS growth with $4.5B of visibility, a net cash balance sheet, and a CEO who has been at the helm for the entire transformation.
Key Metrics at a Glance
| Financials |
|---|
| FY25 Revenue | $2,490M (+32% Y/y) |
| FY25 Adj EPS | $10.88 (+53% Y/y) |
| FY25 Adj EBITDA | $531M (21.3% margin) |
| FY25 OCF | $440M |
| FY26E Revenue (mid) | ~$3,125M (+25%) |
| FY26E Adj EPS (mid) | $13.75 (+26%) |
| Balance Sheet | Net cash. $391M / $291M debt. |
| Valuation & Market |
|---|
| Current Price | $392.26 |
| Market Cap / EV | $12.0B / $12.1B |
| NTM / FY27E EV / EBITDA | ~19.5x / 20.4x |
| FY26E P/E | ~29x |
| Backlog (signed) | $3.01B (+78%) |
| Visibility Pool | $4.5B |
| Stifel PT | $490 (Buy) |
| Sidoti PT | $505 (Buy) |
What Makes This a Conestoga Stock
- Moat: 3-4x scale on mega DC projects. Integrated site + electrical. Reliability premium on mission-critical timelines. Bonding capacity barrier.
- Growth: DC secular buildout + semiconductor next wave + geographic expansion. Multiple stacked drivers, not a single-catalyst story.
- Management: Cutillo (9yr) led entire transformation. Two new C-suite hires from Dycom/Quanta for next phase. VP IR is former Stifel E&C analyst.
- Quality: 5th year of 35%+ EPS growth. Net cash. 83% OCF conversion. Beat-and-raise cadence. Margins at historic highs and expanding.
- Durability: $4.5B visibility pool. 84% mission-critical backlog. Multi-year hyperscaler relationships with 3-5 year pipelines.
- ESG: MSCI ESG Rating: A.
Negatives / Why We Could Be Wrong
- DC buildout is a 2-3 year cyclical phenomenon, not structural. Multiple compresses 35-50% when orders slow.
- Customer concentration is unstated. DC subset of E-Infra is likely the majority but exact % not disclosed.
- At ~29x FY26E P/E and ~20x NTM EV/EBITDA, the premium multiple requires sustained execution on growth and margins.
- FY27E consensus shows sharp deceleration (revenue +3.4%, EPS +6.4%). If the street is right, multiple compresses.
- New geographic expansion (Texas, PNW) starts at lower margins. Integration execution carries risk.
Next Steps
- Schedule CEO meeting with Joe Cutillo. Key questions: DC concentration, backlog quality, CEC cross-sell quantification, moat durability.
- Track Q1 FY26 earnings for E-Infra growth trajectory and TX joint award announcements.
- Monitor hyperscaler capex commentary and CHIPS Act award timing.
Executive / Management Team — Operating Depth and Governance
| Executive | Current Role | Relevant Background | Why It Matters |
|---|
| Joseph A. Cutillo |
Chief Executive Officer (since 2017) |
30 years of experience leading complex, transformational change. Previously President and CEO of Inland Pipe Rehabilitation LLC, a $200M PE-backed trenchless pipe company, from 2008 to 2015. Earlier held management roles at Ingersoll-Rand and General Electric. B.S. in Mechanical Engineering from Northeastern University. |
Core operator in the case. Led the entire transformation from money-losing highway contractor to $12B DC infrastructure platform. 340,593 shares owned (~$131M). The investment thesis is built on his continued leadership. |
| Nicholas Grindstaff |
Chief Financial Officer (since Jul 2025) |
30+ years of finance and leadership experience. Previously CFO of Cinterra (utility-scale solar contractor) since late 2024. Before that, CFO of Orbital Infrastructure Group (2021–2024). Spent 20+ years at Quanta Services as VP Finance (2011–2021) and Treasurer (1999–2011). M.S. in Accounting and B.S. in Finance from University of Houston. |
Deep infrastructure finance background from Quanta (20+ years). M&A, capital markets, and FP&A expertise directly relevant to Sterling's next phase of growth and acquisition strategy. |
| Dan Govin |
Chief Operating Officer (since Aug 2024) |
30 years of operations and leadership in energy infrastructure. At Quanta Services from 2007 as Regional President, President of Par Electrical Contractors, and SVP Operations. Prior roles in energy infrastructure since 1994. MBA from Crummer School at Rollins College, B.S. from University of Wisconsin Green Bay. |
Operational execution for electrical services scaling and CEC integration. Quanta is the gold standard in E&C operations. His regional president experience is directly applicable to Sterling's geographic expansion strategy. |
| Mark D. Wolf |
General Counsel, CCO & Corporate Secretary |
Corporate legal and compliance leadership. Oversees governance, regulatory compliance, and M&A legal execution. |
Relevant for M&A execution discipline, compliance, and governance quality as Sterling scales through acquisitions. |
| Noelle Dilts |
VP IR & Corporate Strategy |
Former Stifel equity research analyst covering the E&C sector. Joined Sterling 2023. |
Notable: Knows exactly what buyside wants. Investor communication quality is above-average for SMID E&C. Coverage-quality IR presentations. |
Quanta connection: Both the new CFO (Grindstaff, 20+ years at Quanta) and COO (Govin, Regional President at Quanta) come from the same tier-1 E&C platform. This is not coincidence — Quanta is the gold standard for infrastructure services scaling. Sterling is importing the operational playbook that built a $46B company. Cutillo at 9 years, 340K shares (~$131M), with no signs of departure.
Management Incentives & Governance Alignment — Proxy Read-Through
What Looks Good
- 60% PSUs / 40% RSUs (upgraded from 50/50 in 2024). PSU metrics: 2/3 cumulative 3-year EPS, 1/3 relative TSR vs peers (0–200% payout).
- Historical payout is real: 2022 and 2023 PSU tranches both paid at 200% max on 2024 Adj EPS of $6.10 vs targets of $3.06–$3.49.
- 2024 STI paid 199% of target. Adj EBITDA $324.8M vs $325.1M max ceiling. Formulaic, not discretionary.
- CEO special PSU: 160K shares ($27M+) with stock price milestones ($100/$120/$140). All three targets achieved.
- Say-on-pay: >97%. No ISS/Glass Lewis opposition disclosed. Double-trigger CIC on 2024+ grants.
- Ownership guidelines: CEO 5x salary ($5M), NEOs 3x. Cutillo exceeds at 1.4% ($131M+).
Why It Matters For The Case
- Board is explicitly paying management for EPS compounding + peer-relative TSR outperformance. That matches the bull case.
- Cutillo owns 436,188 shares (1.4%, ~$131M+) plus 160K special PSUs. Meaningful skin in the game at current prices.
- LTI target at 350% of base salary for CEO ($3.5M target). Structure is heavily performance-levered.
- 83% independent board with separate Chair/CEO. 100% independent committees. All directors attended 100% of 2024 meetings.
- Capital allocation discipline: M&A at 4-6x EBITDA, buybacks at avg $168.72, no value-destructive deals in 9 years.
What To Keep Balanced
- Pre-2024 equity is single-trigger CIC. Only 2024+ grants have double-trigger. Legacy grants vest on CIC alone.
- CIC severance for Cutillo is 3x (base + target bonus) = ~$6.5M. Executive-friendly but within market norms.
- Total insider ownership only 2.7%. Most is Cutillo (1.4%) and Ballschmiede (0.8%). COO Govin has just 634 shares — too new.
- Customer concentration disclosure remains a governance gap. Not disclosing DC % of E-Infra or top customer.
- 6-person board is lean. Added Rose and Schulz in Jul 2025 (now 8), which helps. Monitor for further additions.
Proxy takeaway: STRL is being governed and incentivized like a performance-driven compounder, not a promotional E&C story. LTI is 60% performance-based on EPS + TSR. Both recent PSU cycles paid at max (200%). CEO owns $131M+ in stock. The only meaningful governance blemishes are pre-2024 single-trigger CIC equity and the customer concentration disclosure gap. Auditor: Grant Thornton LLP. Consultant: Meridian Compensation Partners. MSCI ESG Rating: A.
Board & Leadership Pedigree — Infrastructure Operator DNA
Board of Directors
| Board Member | Relevant Pedigree | Why It Matters |
|---|
Roger A. Cregg
Chairman | Independent director at Comerica, Inc. President of Avatar Properties. MBA from Kellogg (Northwestern), B.S. Accounting from Northeastern. Former executive roles in homebuilding and real estate. | Financial governance depth plus real estate/construction industry exposure. Both he and Cutillo are Northeastern alums. |
| William T. Bosway | CEO and Chairman of Gibraltar Industries (ROCK). Infrastructure products manufacturer. | Brings active CEO perspective from a peer-adjacent infrastructure company. Directly relevant to Sterling's industrial/infrastructure positioning. |
Andrew Rose
Added Jul 2025 | Former President and CEO of Worthington Enterprises. Transformational operator who led Worthington through major strategic evolution. | Operational excellence and corporate transformation pedigree. Pattern-matched to Sterling's own transformation story. |
David Schulz
Added Jul 2025 | EVP and CFO of Wesco International ($22B distribution company). Deep financial expertise at scale. | CFO of a $22B company provides board-level financial oversight as Sterling scales from $2.5B to $4B+ revenue. |
| Julie A. Dill | Non-Executive Director at Rayonier Advanced Materials. Prior utility and energy leadership roles. | Energy and infrastructure regulatory experience. |
| Dana C. O'Brien | SVP, General Counsel and Secretary at Olin Corporation. | Legal and governance expertise from a major industrial company. |
| Dwayne A. Wilson | Director of Ingredion, Inc. Prior senior leadership roles. | Public company board governance experience. |
Takeaway: Board was refreshed in July 2025 with two additions (Rose from Worthington, Schulz from Wesco) adding operational and financial scaling expertise. Combined with the management team's deep Quanta Services DNA (CFO + COO), Sterling has assembled a leadership bench specifically calibrated for the next phase: scaling from $2.5B to $4B+, integrating acquisitions, and expanding geographically.
Transformation Architect
Joe Cutillo joined Sterling in 2017 as CEO when the company was a money-losing highway contractor trading at ~$15/share. He identified and executed the strategic pivot from commodity highway work to mission-critical E-Infrastructure, culminating in the CEC acquisition that created a $12B integrated DC infrastructure platform.
Why it matters: The entire investment case was built by one operator over 9 years. This is not a financial engineering story or a roll-up — it is a strategic transformation led by an operator who saw the DC opportunity before the market.
Bench Deepened for Next Phase
In 2025, Cutillo made two simultaneous C-suite hires: CFO Sharon Villaverde from Dycom Industries (VP/CAO) and COO Dan Govin from Quanta Services (President, Quanta West). Both are infrastructure veterans from the two most respected E&C operators.
Why it matters: This signals building the management infrastructure for scaling to $4B+ revenue, not succession planning. The hires bring M&A integration expertise (Dycom) and electrical utility operations (Quanta) — directly relevant to CEC integration and geographic expansion.
Corporate Culture: "The Sterling Way" — Employer of Choice in E&C
Safety & Operational Excellence
- EMR (Experience Modification Rate): Plateau's EMR is 0.74 vs industry average of 1.00. Safety record ~10x better than broader construction industry.
- "The Sterling Way" — proprietary operational and cultural framework spanning corporate strategy to daily field operations. Enforces rigorous safety, quality, and bid discipline.
- Sterling Academy (Transportation), CEC University (electrical), Plateau training school (site dev) — formal training infrastructure across all three platforms.
- PM training pipeline: 4+ year program recruiting and training 5+ project managers annually. Adds ~$500M of annual capacity as program matures.
Why It Matters for Investors
- Safety record is a competitive moat: hyperscalers prioritize safety first, eliminating ~90% of potential competitors.
- Retention and training = compounding institutional knowledge on complex mega-projects.
- Employer of choice attracts labor in a tight market. "If I had another 1,000 electricians in Texas, I could put them to work in 30 days or less."
Workforce & Culture Metrics
| Metric | Value |
|---|
| Total Employees | ~5,000 |
| Union vs Non-Union | Primarily non-union (NE exception) |
| Safety EMR (Plateau) | 0.74 (industry avg: 1.00) |
| Equipment Fleet | One of largest in US E&C |
| PM Capacity Added/Year | ~$500M+ revenue capacity |
| Training Programs | 3 (Academy, CEC U, Plateau) |
| AI/Tech Adoption | BIM, drones, telematics, autonomy |
Insider Ownership
| Insider | Shares | Value |
|---|
| CEO Cutillo | ~330K | ~$131M+ |
| Institutional | 80.95% of float |
Note: CEO sold 50,000 shares on March 25, 2026 at ~$453/share ($22.6M) under 10b5-1 plan. Has sold 100,000 shares since March 9. Still owns $131M+ in stock.
Forward Financial Model: Quarterly Estimates (FY26E-FY27E)
| ($M except EPS) |
Q1'25A | Q2'25A | Q3'25A | Q4'25A | FY25A |
Q1'26E | Q2'26E | Q3'26E | Q4'26E | FY26E |
| Revenue | $431 | $615 | $689 | $646 | $2,381 | $552 | $746 | $824 | $696 | $2,818 |
| Y/y | +30% | +35% | +37% | +32% | +33% | +28% | +21% | +20% | +8% | +18% |
| Adj EPS | $1.63 | $2.69 | $3.48 | $2.71 | $10.51 | $2.23 | $3.47 | $4.01 | $3.01 | $12.73 |
| Y/y | +42% | +55% | +60% | +43% | +50% | +37% | +29% | +15% | +11% | +21% |
| EBITDA Margin | 17.5% | 20.2% | 21.8% | 19.8% | 20.0% | 19.5% | 21.5% | 22.5% | 20.8% | 21.2% |
FY27E Summary (Stifel)
| Q1'27E | Q2'27E | Q3'27E | Q4'27E | FY27E | Y/y |
|---|
| Revenue | $594 | $801 | $889 | $751 | $3,035 | +8% |
| Adj EPS | $2.46 | $3.77 | $4.37 | $3.30 | $13.91 | +9% |
Key Model Assumptions
- E-Infra: +25-30% Y/y in FY26 (DC secular + CEC full year). Deceleration to +10-15% in FY27 as base grows.
- Transportation: +8-10% Y/y. IIJA funding + alt delivery mix improving.
- Building Solutions: Flat to -5% in FY26 on housing softness. Recovery H2'26 / FY27.
- Margins: EBITDA margin 21%+ sustained. CEC mix accretive. E-Infra op margins 23-25%.
- CapEx: ~3% of revenue. Working capital favorable in Transport + Building.
- Share count: ~30.6M diluted. $374M buyback remaining.
Source: Stifel Research estimates, February 2026. Blair estimates FY26E: Rev $3.15B, EBITDA $643.6M, EPS $13.79.
Management Execution: Guidance vs. Actuals Track Record
| Period | Revenue Guide | Revenue Actual | Result | EPS Guide | EPS Actual | Result |
|---|
| FY2022 | $1.58-1.63B | $1.69B | Beat +5% | $4.25-4.50 | $4.72 | Beat +7% |
| FY2023 | $1.72-1.82B | $1.97B | Beat +11% | $4.60-5.00 | $5.15 | Beat +6% |
| FY2024 | $1.88-2.00B | $2.12B | Beat +9% | $5.80-6.20 | $6.24 | Beat +2% |
| FY2025 | $2.35-2.50B | $2.49B | Beat +2% | $9.70-10.20 | $10.88 | Beat +10% |
| FY2026 Guide | $3.05-3.20B | — | — | $13.45-14.05 | — | — |
4 consecutive years of beat-and-raise. Revenue guidance beaten by avg +7%. EPS guidance beaten by avg +6%. Management consistently guides conservatively and delivers upside. FY26 guide of $3.05-3.20B is ~10% above street consensus at time of guidance.
Quarterly Beat Cadence
- Q4 2025: Revenue beat, EPS beat. E-Infra +67% organic.
- Q3 2025: Revenue beat, EPS beat. Raised FY guidance.
- Q2 2025: Revenue beat, EPS beat. Raised FY guidance.
- Q1 2025: Revenue beat, EPS beat. Raised FY guidance.
- Pattern: Beat every quarter, raise guidance every quarter.
M&A Strategy: Fragmented Market, Disciplined Execution, Accretive Multiples
Acquisition Criteria
- Focus: Site development, specialty electrical, geographic expansion. ~95% of M&A pipeline is E-Infrastructure.
- Multiples: Typical MSD-x EBITDA range. Higher for specialty (CEC at 9.6x), lower for residential (Drake at 3.8x).
- Pipeline: Management evaluates >100 deals per year. Highly selective.
- Integration: Decentralized model. Subsidiaries maintain brand identity (Plateau, Petillo, CEC, Wadsworth).
- Balance sheet capacity: Net cash position. 2.5x leverage target provides significant firepower. $374M buyback remaining.
Potential Fourth Leg
- Management has discussed adding a fourth business segment with exposure to positive infrastructure trends and/or recurring revenue.
- Mechanical services (particularly piping) is a natural extension from site dev + electrical.
- Self-power generation on DC campuses creates new scope opportunity.
Acquisition Track Record
| Year | Target | Multiple | Strategic Rationale |
|---|
| 2025 | CEC Facilities | 9.6x | Specialty electrical. DC cross-sell. |
| 2025 | Drake Concrete | 3.8x | Building Solutions tuck-in. |
| 2022 | Petillo | 5.0x | NE site dev. Micron exposure. |
| 2019 | Plateau Excavation | 5.6x | SE site dev. Created E-Infra. |
| 2017 | Tealstone | ~4x | Entered residential (DFW slabs). |
Multiple arbitrage: STRL trades at low-20s NTM EV/EBITDA. Acquiring at 4-10x = highly accretive from day one. Industry remains fragmented (>10,000 competitors nationally). Regional E&C owners "see this tremendous opportunity ahead of them and they're not able to capitally fund the growth." They risk being "on the outside looking in."
Appendix: Q4 2025 Earnings Call Synthesis
Key management quotes and data points from the February 26, 2026 earnings call.
On DC Demand & Scale
- "Remember when we were so excited we got the first 100-acre data center? We just started one in Texas, and the parking lot is 100 acres."
- "These aren't data centers anymore, they're data campuses."
- "As we look ahead to the next three to five years and work with them on their planning, we don't see anything slowing down. If anything, we continue to see it accelerating."
On Texas & Geographic Expansion
- "The Texas market is on fire, to say the least. It is unbelievable what is happening in Texas."
- "We're attacking that from the east, and we're attacking it from the west, and then we've got our CEC business right in the middle of Dallas."
- "In the first half of this year, we're going to be able to talk about some very nice awards that take place in Texas."
- "If I had another 1,000 electricians in Texas, I could put them to work in 30 days or less."
On CEC Cross-Sell & Modular
- "Ahead of schedule and more optimistic about the strength of putting these two together and the responses that we're receiving from customers."
- "The new facility is over 300,000 square feet. We're looking at multiple facilities throughout the U.S."
- "Insignificant [capex] on what it frees up for capacity and how it positively impacts your margins."
On Semiconductor & M&A
- "A semiconductor plant that are coming out will be closer to seven to 10 year projects. Instead of hundreds of millions, the total scope could approach $1 billion."
- "We are seeing more high-quality acquisition targets in the market today than we did a year ago."
- "A lot of these owners see this tremendous opportunity ahead of them and they're not able to capitally fund the growth."
On AI Adoption
- "We picked up somewhere between 15% to 20% of incremental capacity of project managers just from our first AI project."
- "We've got six AI projects underway right now."
Appendix: Geographic Expansion Map
Current & Planned Geographic Footprint
| Region | Status | Key Driver | Timeline |
|---|
| Southeast (core) | Established | DC site development. Legacy Plateau business. Highest margins. | Ongoing. Multi-year hyperscaler programs. |
| Northeast (Petillo) | Established | Semiconductor (Micron $100B potential). Some DC activity emerging. | Awards expected 2026. CHIPS Act catalyst. |
| Rocky Mountain | Ramping | Mission-critical DC. Grew +150% Y/y. Equipment investment underway. | FY26 continued ramp. Margin improvement as equipment optimized. |
| Texas (CEC core) | Accelerating | DC electrical (CEC). Site dev entering from east (Plateau) and west (Rocky Mtn). Meta $10B El Paso. | Joint awards H1 2026. "On fire." |
| West Texas | Active | DC site development. "Actively working and winning jobs." Awards Q1 2026. | Attacking from Rocky Mountain resources. |
| Pacific Northwest | Entering | "Several projects likely released 2027." Moving assets/resources in 2026. | Setup 2026. Awards 2027. |
| Ohio / Indiana | Potential | "Fairly sizable market." Haven't figured out entry yet. "Not on the 10-yard line." | Longer-term opportunity. |
Strategic Logic
Cutillo on geographic expansion: "When you see our geographic expansion taking place over the next 12 to 18 months, it's not necessarily because there's something there today. It's because we know something is coming in the future. And we're working with our customers to be prepared for that."
- Geographic expansion follows customer demand signals. Hyperscalers are pulling Sterling into new geographies, not the reverse.
- Each new geography starts with lower margins (equipment conversion, ramp). Margins converge to core levels over 12-18 months as purpose-built equipment deployed and processes replicated.
- Tuck-in acquisitions provide instant geographic presence, local relationships, and labor force. "Pick the best ones" after establishing site dev presence.
- Vertical integration (dry utilities, other services) follows initial site dev entry. Georgia dry utility acquisition already showing "significant margin improvements."
Appendix: Backlog Analysis
Backlog Progression
| Period | Signed Backlog | Combined Backlog | Mission-Critical % | Book-to-Burn |
|---|
| Q4 2024 | $1.69B | $1.82B | 80% | — |
| Q3 2025 | ~$2.5B | — | — | — |
| Q4 2025 | $3.01B | $3.31B | 84% | 1.64x |
| Y/y Change | +78% | +81% | +400 bps | — |
| Ex-CEC (same store) | +~50% | +~42% | — | — |
Visibility Pool Breakdown
| Component | Amount | Description |
|---|
| Signed Backlog | $3.01B | Contracted work. Includes all three segments. |
| Unsigned Electrical Awards | $301M | CEC awards not yet under formal contract. |
| Future Phase (Site Dev) | $1B+ | "Tied to projects we're actively working on today." Minimum to finish existing projects. Real work, internal capacity planning. |
| Total Visibility Pool | ~$4.5B | 18-24 months of coverage at current run rates. |
Backlog Quality Assessment
- Mission-critical at 84% of E-Infra signed backlog (up from 80%). DC, semiconductor, large manufacturing.
- E-Infra backlog + unsigned + future phase: $3B+ aggregate. Exclusively E-Infra segment.
- Transportation backlog: $1.1B (+81% Y/y). Over two years of work. Strong award activity.
- Future phase is real work: Tied to existing active projects. Released in packages. "Internally for capacity planning, it's backlog for us."
Open Questions for Management Meeting
- What are the backlog cancellation provisions? How firm is $3B? What happens if a customer pushes 6-12 months?
- What is the backlog duration distribution? Average project timeline?
- Is 1.64x book-to-burn sustainable or peak?
- What triggers conversion of "future phase" to signed backlog? Timing?
- How much is direct hyperscaler vs through GCs/developers?
Appendix: Sellside Research Detail — 7 Analysts, All Buy-Rated
| Broker / Analyst | Rating | PT | Quality | Key Thesis & Notable Points |
|---|
William Blair
Louie DiPalma, CFA | OP | — | 9/10 |
Most comprehensive coverage. 25-page initiation (Jan '25). Projects DC revenue $977M by 2030 from $352M in 2024. Values at 18x 2027E EBITDA vs peers at 20x. "Even after tenfold increase since 2020, just getting started." Expects 20%+ annual stock return. Mar 27: Sterling believed to be leading site developer for Meta's $10B El Paso campus. DC campuses 50 acres (2018) → 1,000+ acres today. Texas to become #1 market within 5 years. Feb 26 Q4 Note: Raised estimates to $3.15B rev / $643.6M EBITDA / $13.79 EPS for FY26. "67% organic E-Infra growth highlights sustained mission-critical demand." Feb 5: Google & Meta raised 2026 capex 97% and 25% vs Oct expectations. STRL at 19x EBITDA, below 20x DC infrastructure peer avg.
|
Stifel
Brian Brophy | Buy | $490 | 8/10 |
Initiation Feb 2026. DC, manufacturing, distribution >50% of revenue. DC alone >30%. Vertical integration + BIM/drones create barriers to entry. Trades at 1.5-turn EBITDA discount to specialty peers. Q4 Recap (Mar 2): Remain positive on whitespace opportunity in Texas. E-Infra drove beat. Awards +109% Y/y. Progress on Texas entry + CEC integration points to acceleration in 1H26. Raised PT from $486 to $490. Notable: VP IR Noelle Dilts is former Stifel E&C analyst — institutional-quality coverage relationship.
|
DA Davidson
Brent Thielman | Buy | $460 | 8/10 |
Multiple notes since Feb 2025 upgrade. Raised PT from $355 → $460 after CEC close (transformational impact). Houston management update positive (Dec '25). CEC adds specialty electrical services cross-sell. Q4 Note (Feb 26): "Biz pipeline very healthy." Raised estimates and PT. Asked about CEC pipeline evolution and margin thresholds on earnings call. E-Infra Momentum (Nov '25): Highlighted accelerating award pace and geographic expansion as sustainable growth vectors.
|
Sidoti
Julio Romero | Buy | $505 | 8/10 |
Highest price target. "Execution at scale continues to resonate with larger, mission-critical projects." Raised FY26E EPS to $12.64, FY27E to $15.78. Values at ~27x FY27E. Highlighted modular build expansion and self-power generation as next frontier. Asked about above-ground vs underground mix shift, semiconductor margin comparability, and AI productivity gains on earnings call. Pre-Q4 Note (Feb 23): "Well-positioned to monetize its ability to alleviate physical constraints and handle rising complexity across mission-critical projects."
|
Thompson Davis
Adam Thalhimer | Buy | — | 7/10 |
Focused on CEC modular expansion (300K sqft facility tripling) and Building Solutions M&A opportunity at depressed multiples. Constructive on the cyclical recovery option value in residential.
|
Texas Capital
Alex Rygiel | Buy | — | 7/10 |
Regional coverage. Focused on semiconductor TAM sizing (CHIPS Act pipeline) and manufacturing. Constructive on Texas market growth.
|
Cantor Fitzgerald
Manish Somaiya | Buy | — | 7/10 |
Focused on future phase work conversion timing, capital allocation priorities (M&A vs buyback), and potential fourth leg expansion (mechanical). Asked about self-power generation scope on next-gen DC campuses.
|
Sellside summary: 7 analysts, all Buy-rated. Average PT (where disclosed): $489 (+25% upside). Three highest-conviction notes (Blair, Stifel, Sidoti) all emphasize the same structural thesis: DC infrastructure demand is secular, not cyclical, and Sterling's scale + integrated offering creates a durable competitive moat. No neutral or negative ratings. Coverage expanded from 4 to 7 analysts in the last 12 months — institutional awareness accelerating.
Appendix: Relative Performance vs. R2500G (5-Year Weekly)
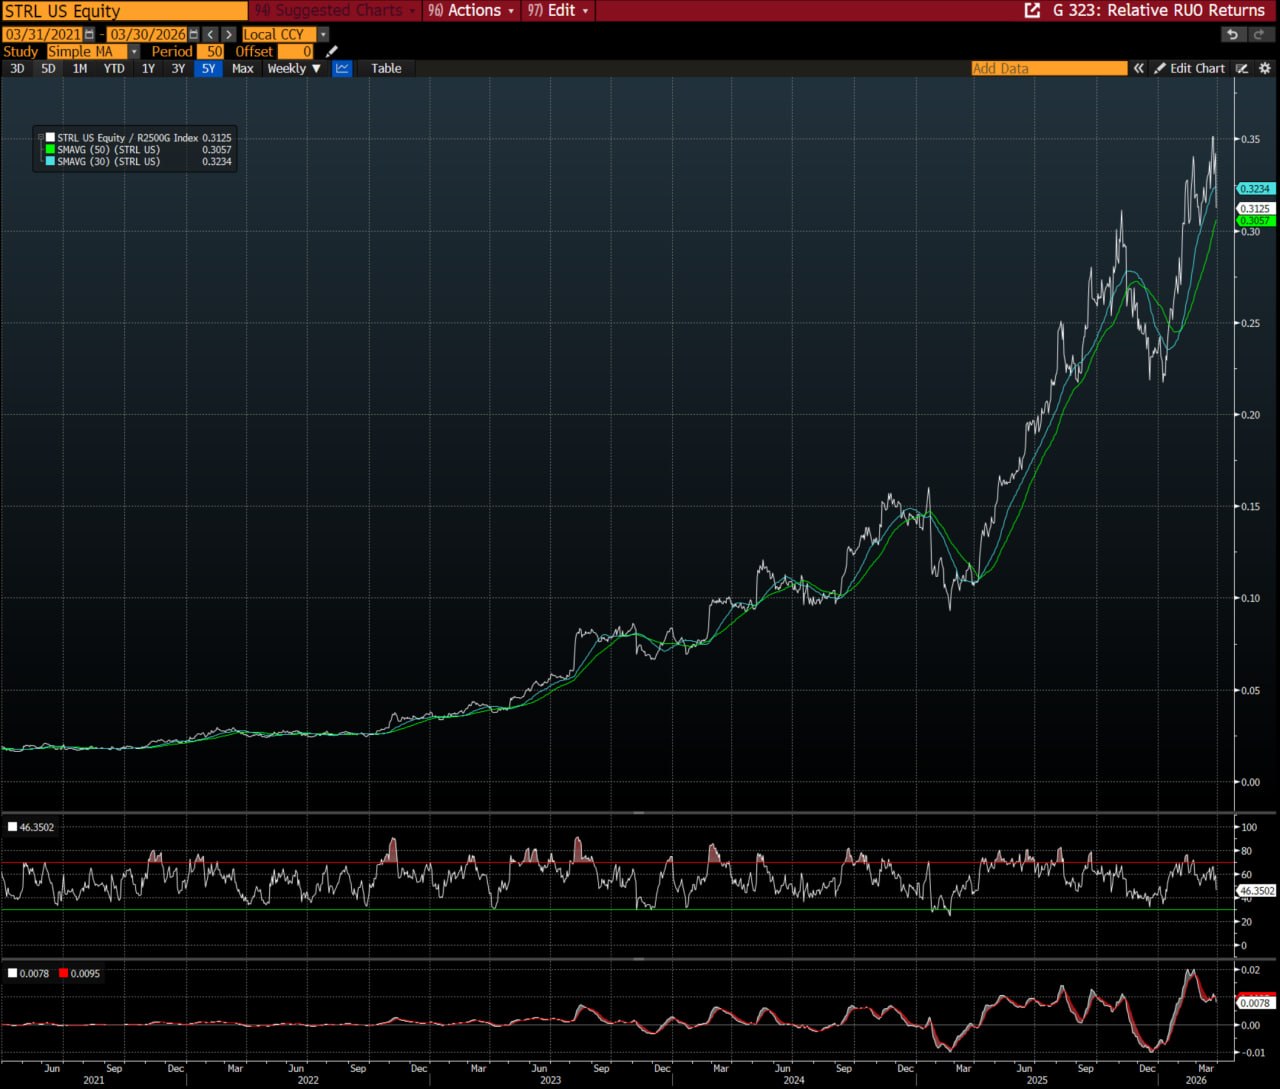
Bloomberg G 323: STRL / R2500G, 5Y weekly, 30W + 50W SMAs, RSI. Source: Bloomberg, March 30, 2026.
Phase Analysis
| Period | Ratio | Phase |
|---|
| Mar '21 – Jun '22 | 0.02→0.06 | Quiet accumulation |
| Jun '22 – Dec '23 | 0.06→0.12 | Inflection. E-Infra narrative |
| Jan '24 – Jun '24 | 0.12→0.15 | Consolidation |
| Jul '24 – Dec '24 | 0.15→0.20 | CEC acquisition. DC recognized |
| Jan '25 – Sep '25 | 0.05→0.27 | Tariff selloff + 5x recovery |
| Oct '25 – Present | 0.27→0.31 | Record Q4. ATH consolidation |
Key Metrics
- 5Y ratio: 0.02 → 0.3125 (~15x outperformance)
- 50W SMA: 0.3057 (above = uptrend intact)
- 30W SMA: 0.3234 (below = near-term consolidation)
- RSI: 46.35 (neutral, not overbought)
- Prior consolidations lasted 2-4 months before resuming
Takeaway: Not a momentum-driven multiple-expansion story. Outperformance has been consistent across 5 years and accelerating as fundamentals deliver. Current consolidation (0.38 peak → 0.31) mirrors prior healthy pullbacks. RSI neutral.
Visual Appendix: Bloomberg RV — Premium to Comp Group
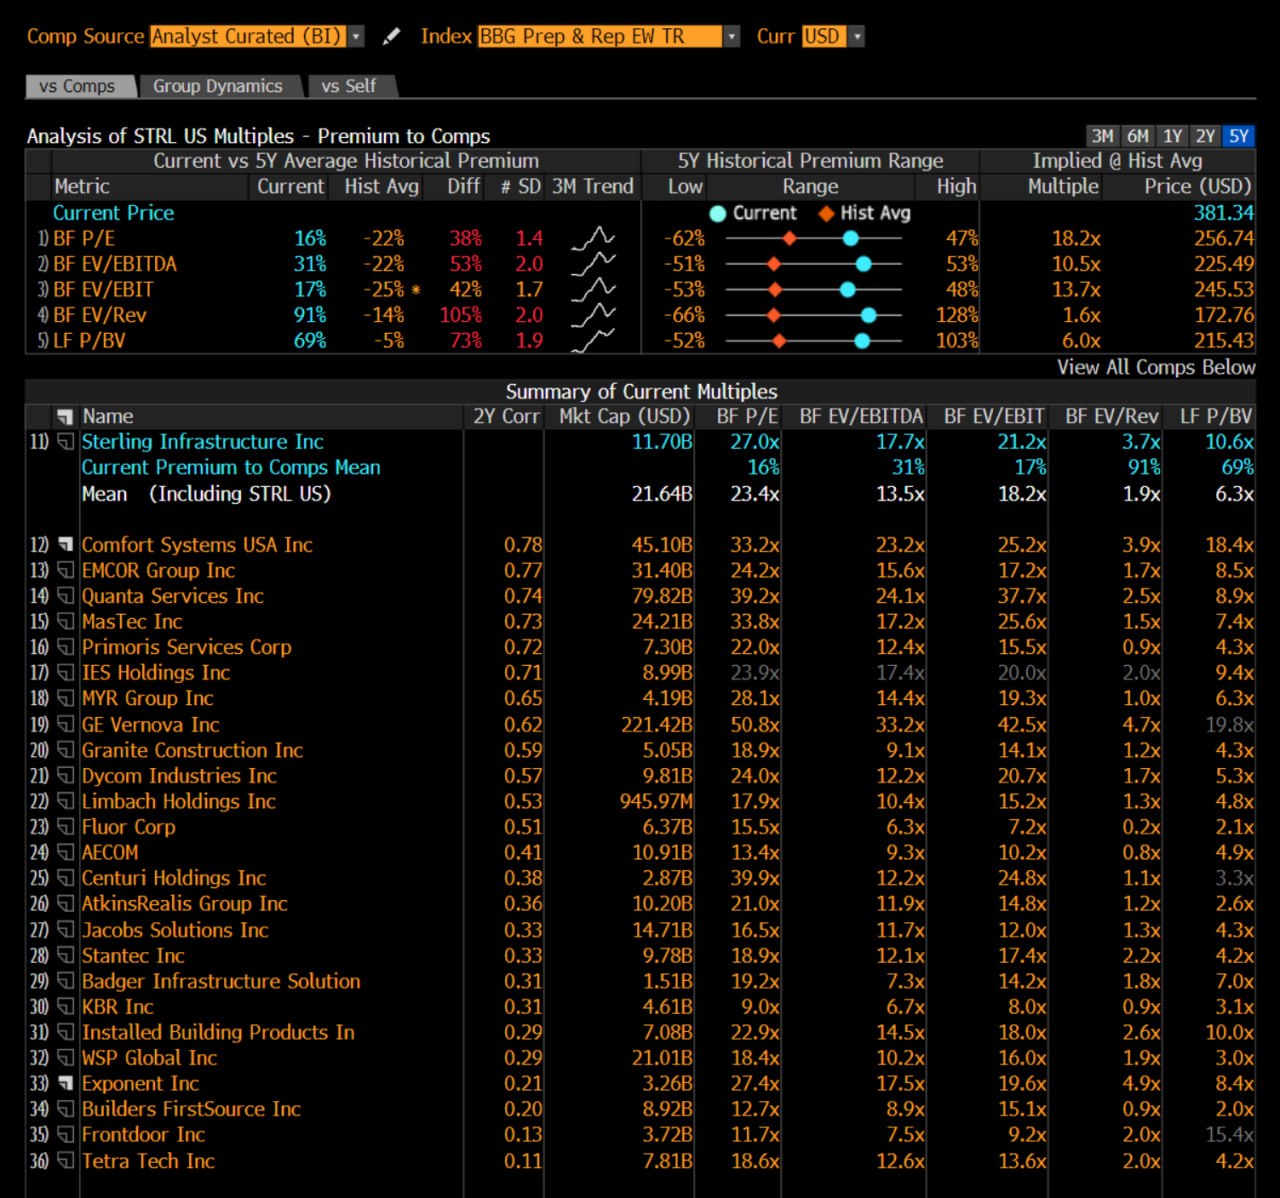
Bloomberg Relative Valuation screen. Source: Bloomberg Terminal, March 30, 2026.
What It Shows
STRL's current multiples vs. the analyst-curated comp group (FIX, EME, PWR, MTZ, IESC, DY, PRIM) with historical premium/discount analysis. BF EV/EBITDA at 17.7x represents a +31% premium to group mean of 13.5x.
Signal: The premium has expanded from near-parity to +31% as the market recognizes the business mix transformation. The premium is justified by 67% organic E-Infra growth, 20%+ EBITDA margins, and net cash. Comparable to the re-rating path of FIX (now at 23.2x) and PWR (24.1x) as they proved durability.
Visual Appendix: Bloomberg RV — EV/EBITDA Group Dynamics
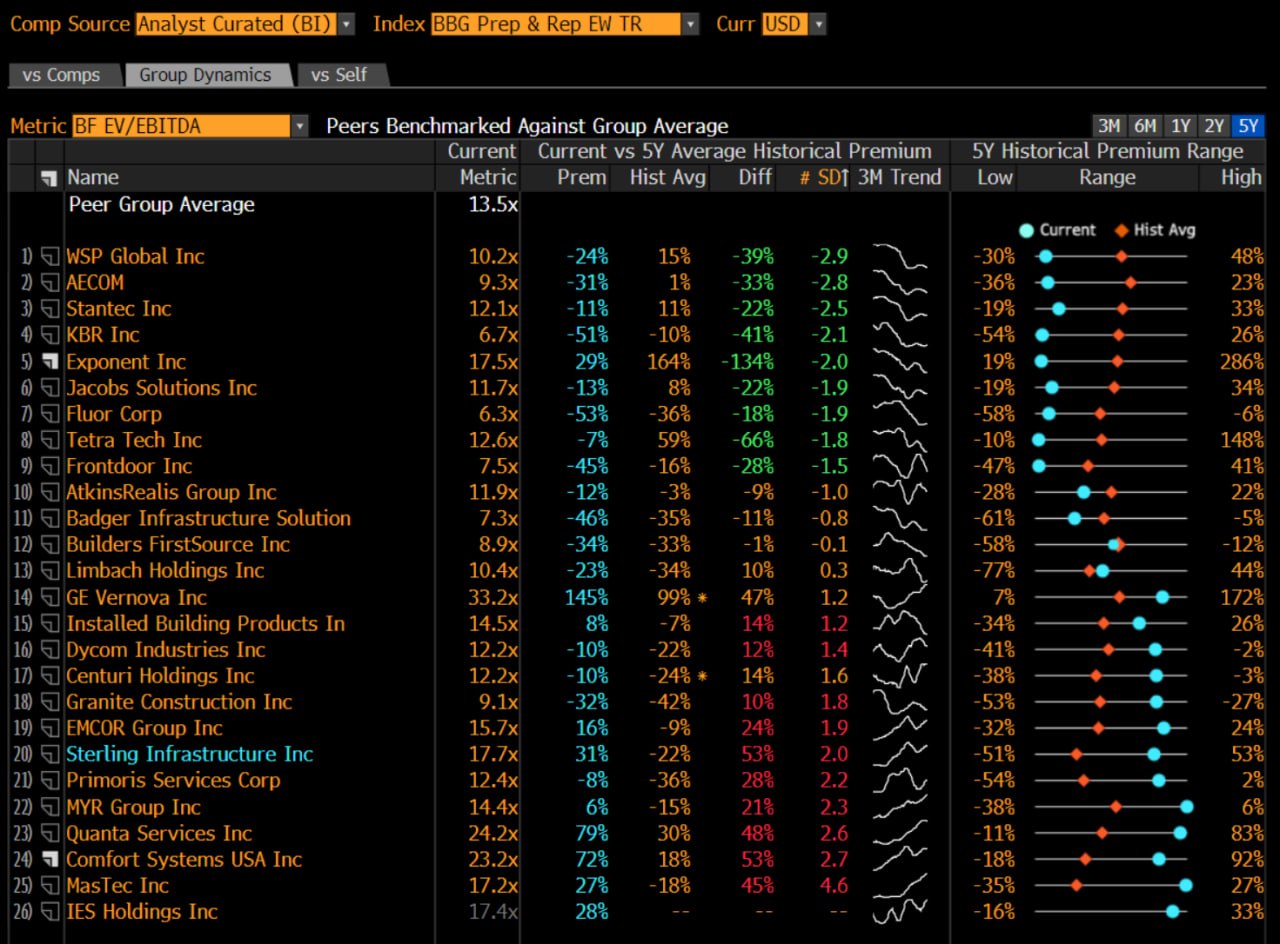
Bloomberg RV Group Dynamics screen showing current vs. 5Y average premiums. Source: Bloomberg Terminal, March 30, 2026.
What It Shows
Each peer's current BF EV/EBITDA premium vs. group average, compared to their 5Y historical average premium. STRL's current premium is at 2.0 standard deviations above historical, near the top of the range.
Watch item: Only FIX (2.7 SD) and MTZ (4.6 SD) trade at wider historical premium spreads. If STRL's growth decelerates, the premium compresses quickly. The key question: is the premium structural (transformed business) or cyclical (DC demand peak)?
Appendix: Company Overview & Segment Map
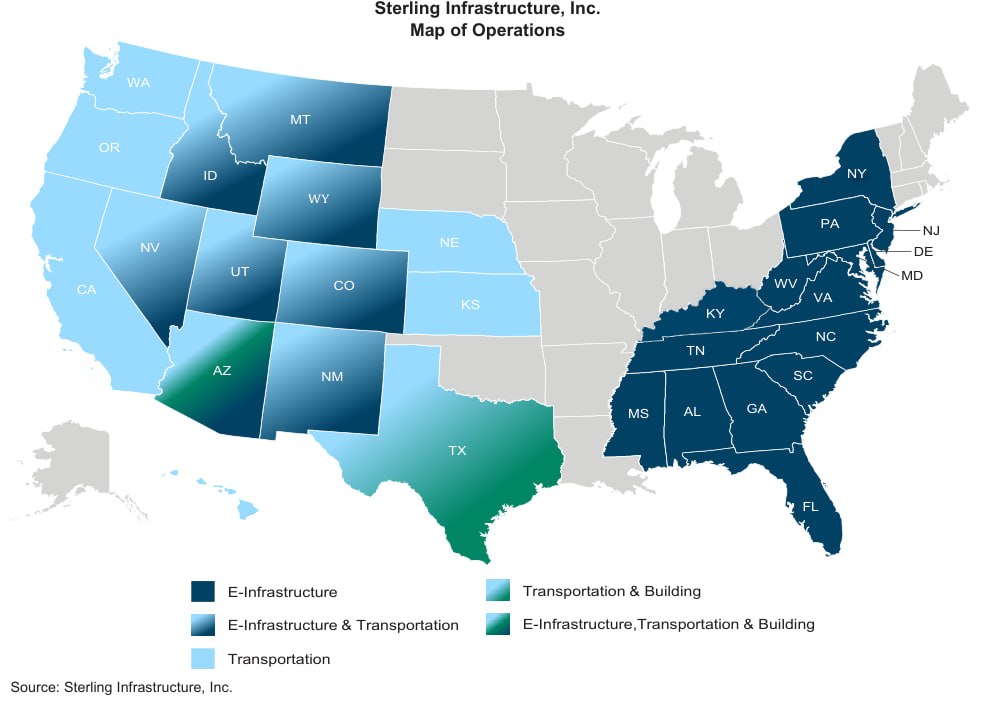
Source: Stifel Research, February 2026 Initiation. ~5,000 employees, primarily non-union except NE (Petillo). E-Infra recently expanded to Texas via CEC + organic. Core: South, NE, Mid-Atlantic, Rocky Mountain.
Appendix: EPS Transformation — $(2.40) to $10.88 in 10 Years
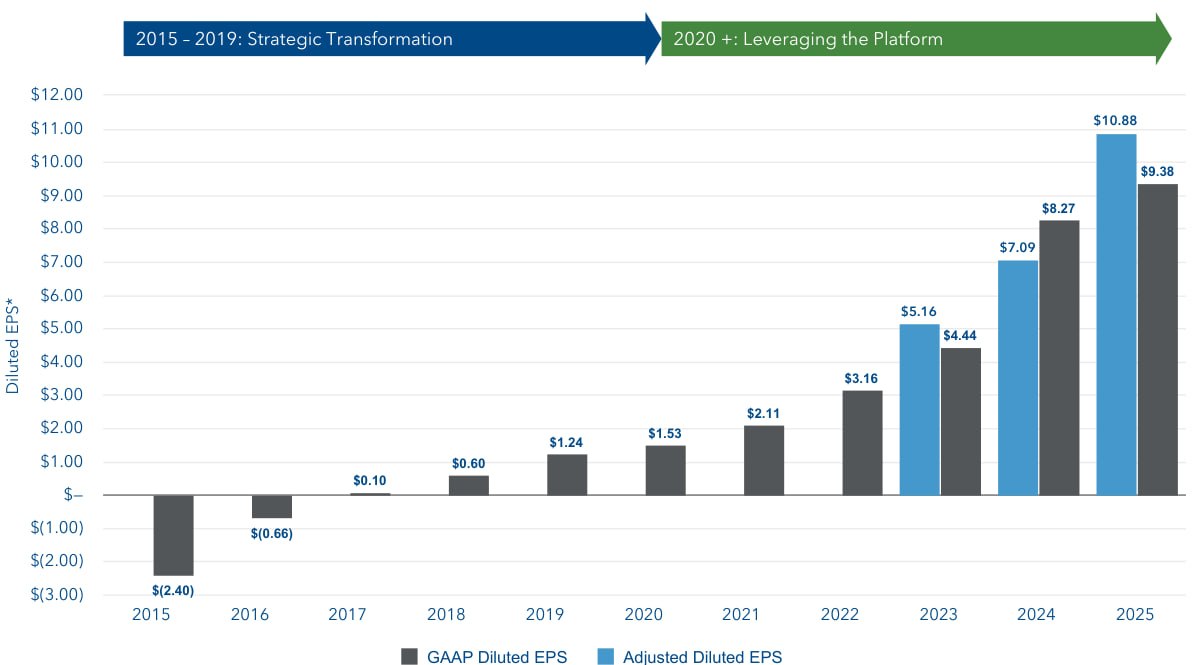
Source: STRL Q4 2025 Earnings Presentation. GAAP Diluted EPS from $(2.40) in 2015 to $10.88 in 2025. Adjusted Diluted EPS from $(2.40) to $9.38. Five consecutive years of 35%+ EPS growth. "2015-2019: Strategic Transformation" → "2020+: Leveraging the Platform."
Appendix: Revenue by Segment & Operating Margin History (2015-2025)
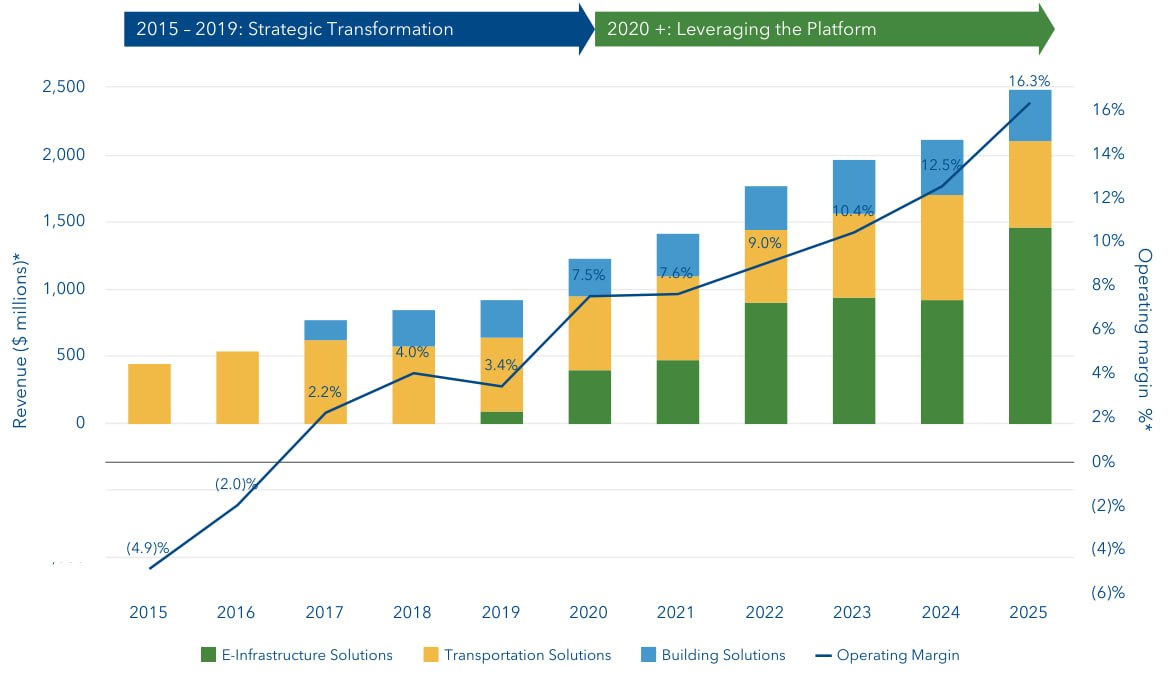
Source: STRL Q4 2025 Earnings Presentation. Revenue from ~$430M (2015) to ~$2,490M (2025), 6x growth. Operating margin from (4.9)% to 16.3%. E-Infrastructure (green) now the dominant segment. Mix shift from Transportation (gold) drove the margin inflection.
Visual Appendix: Business Transformation Infographic
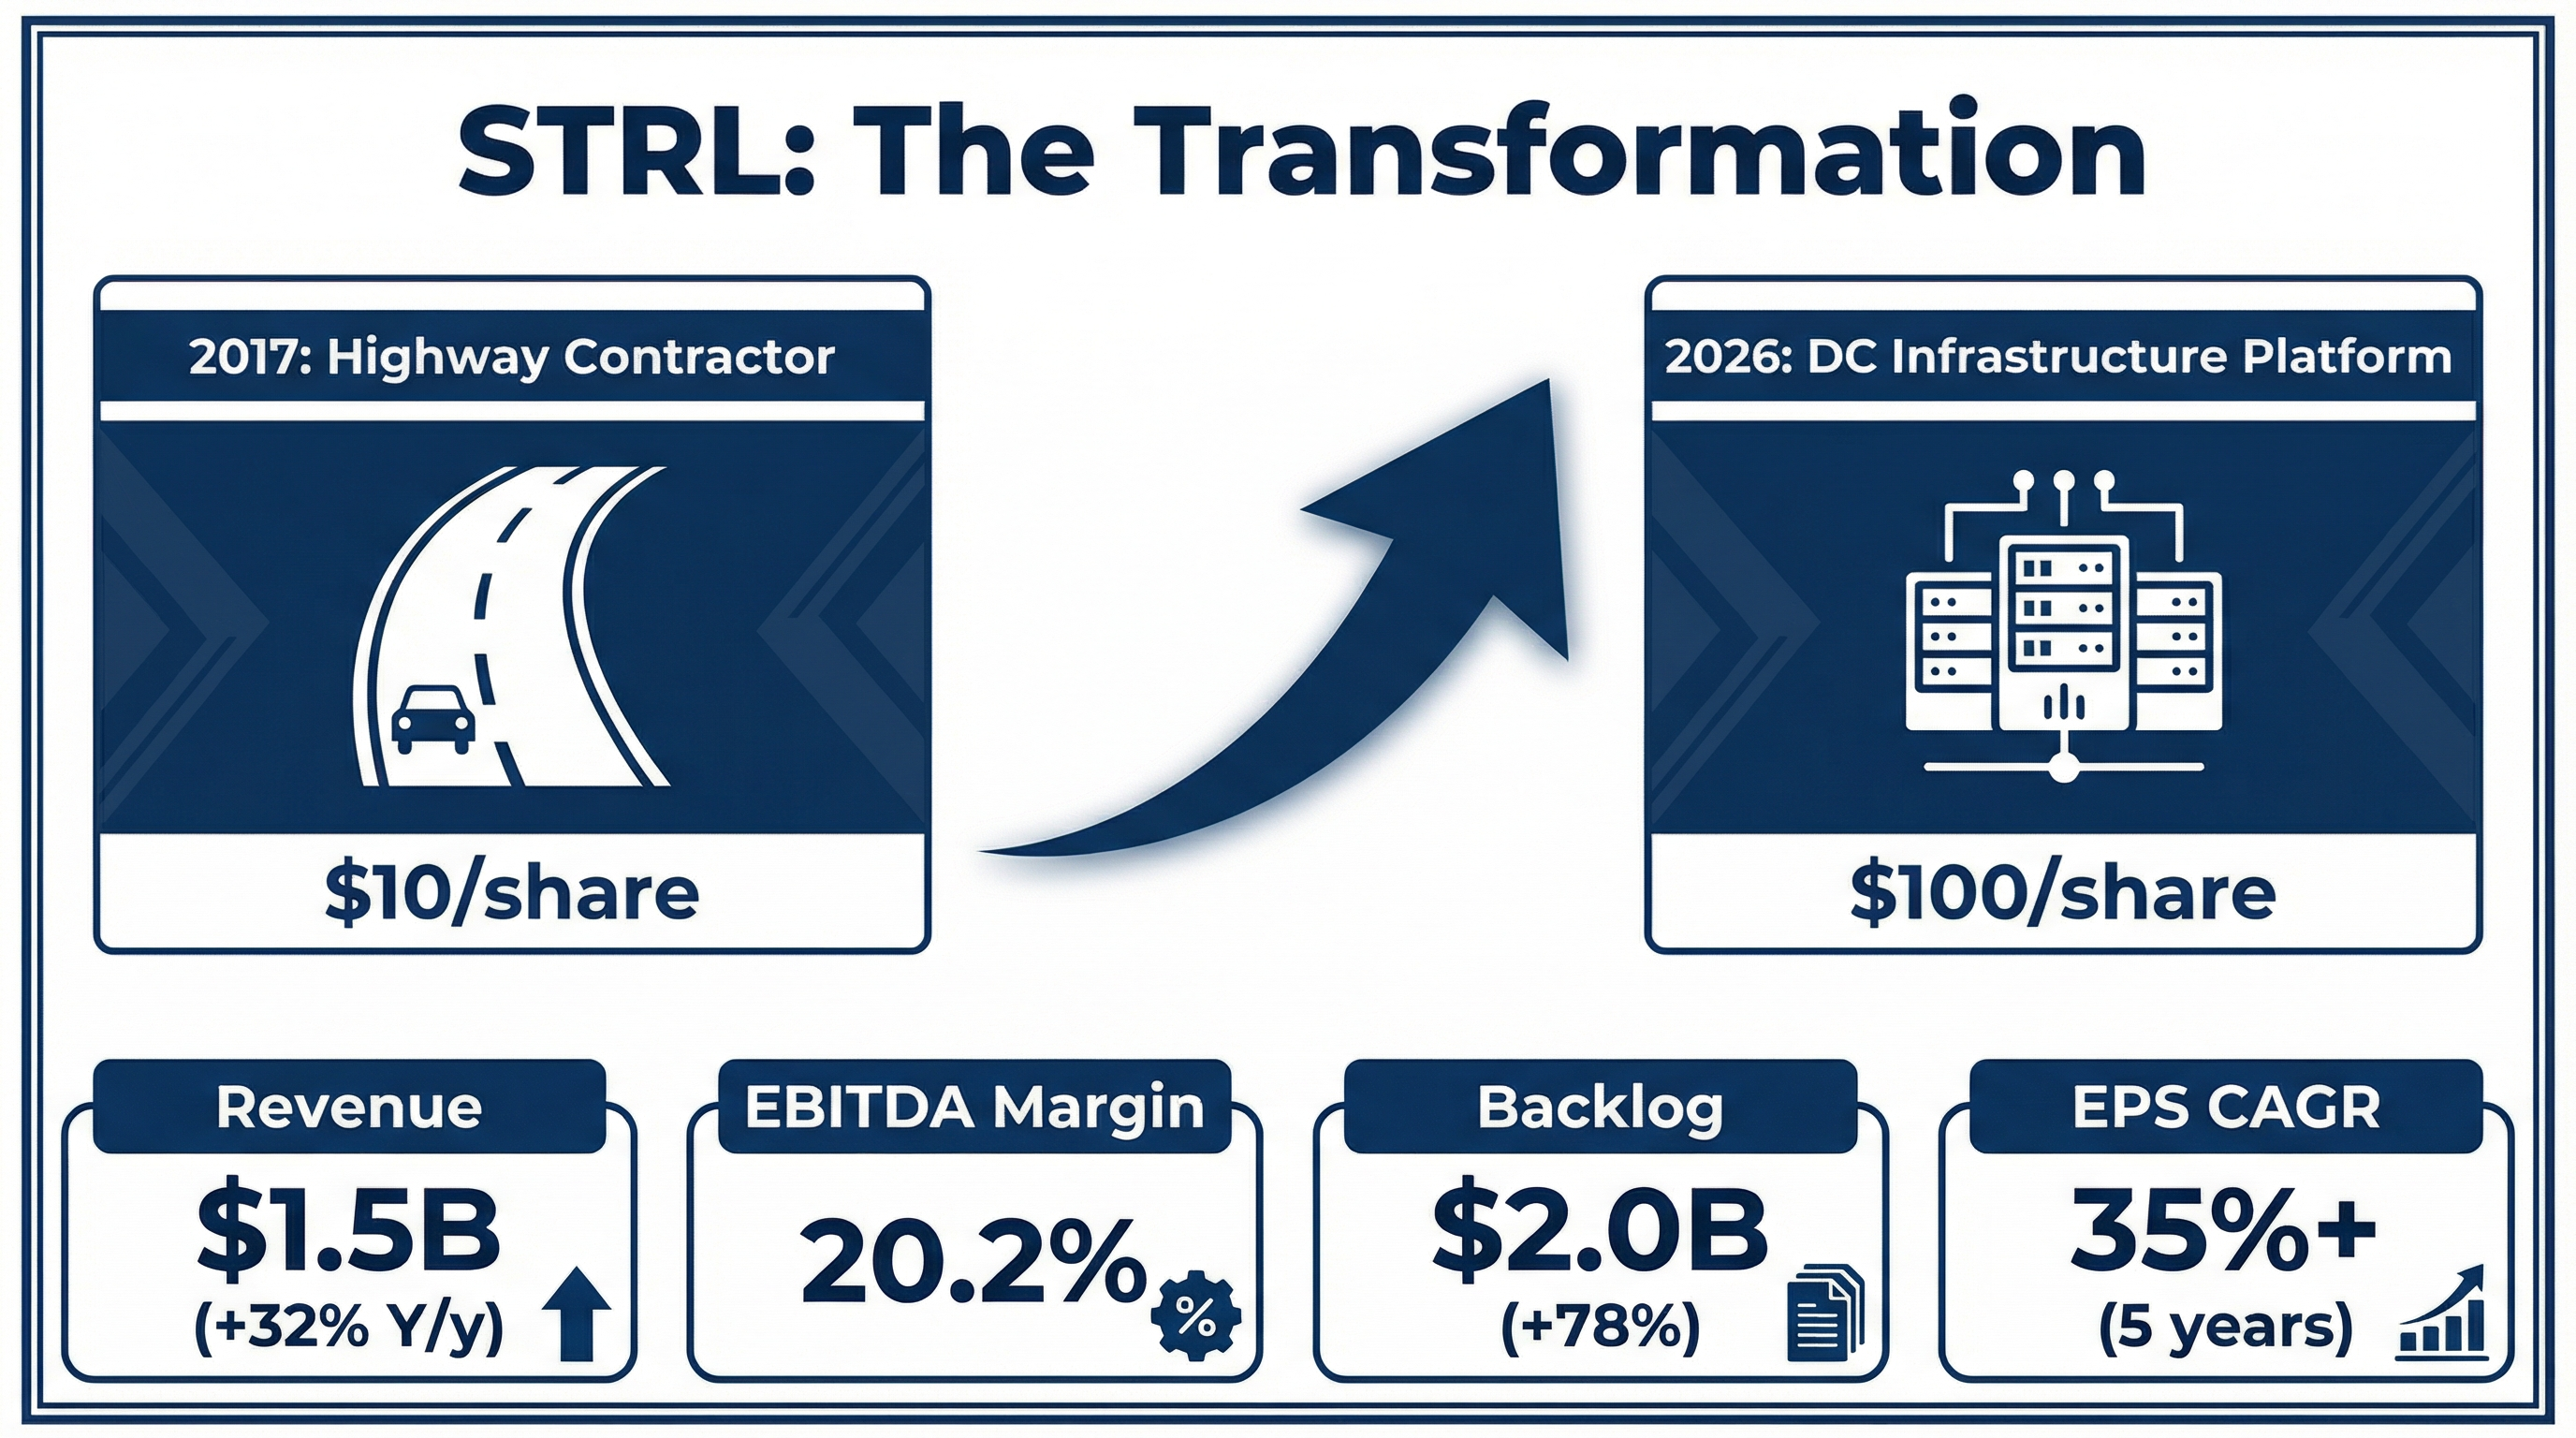
AI-generated infographic: Sterling's decade-long transformation from low-bid heavy highway contractor (79% of revenue, 2016) to mission-critical E-Infrastructure platform (59% of sales, 75% of operating income, 2025).
Visual Appendix: Competitive Moat Infographic
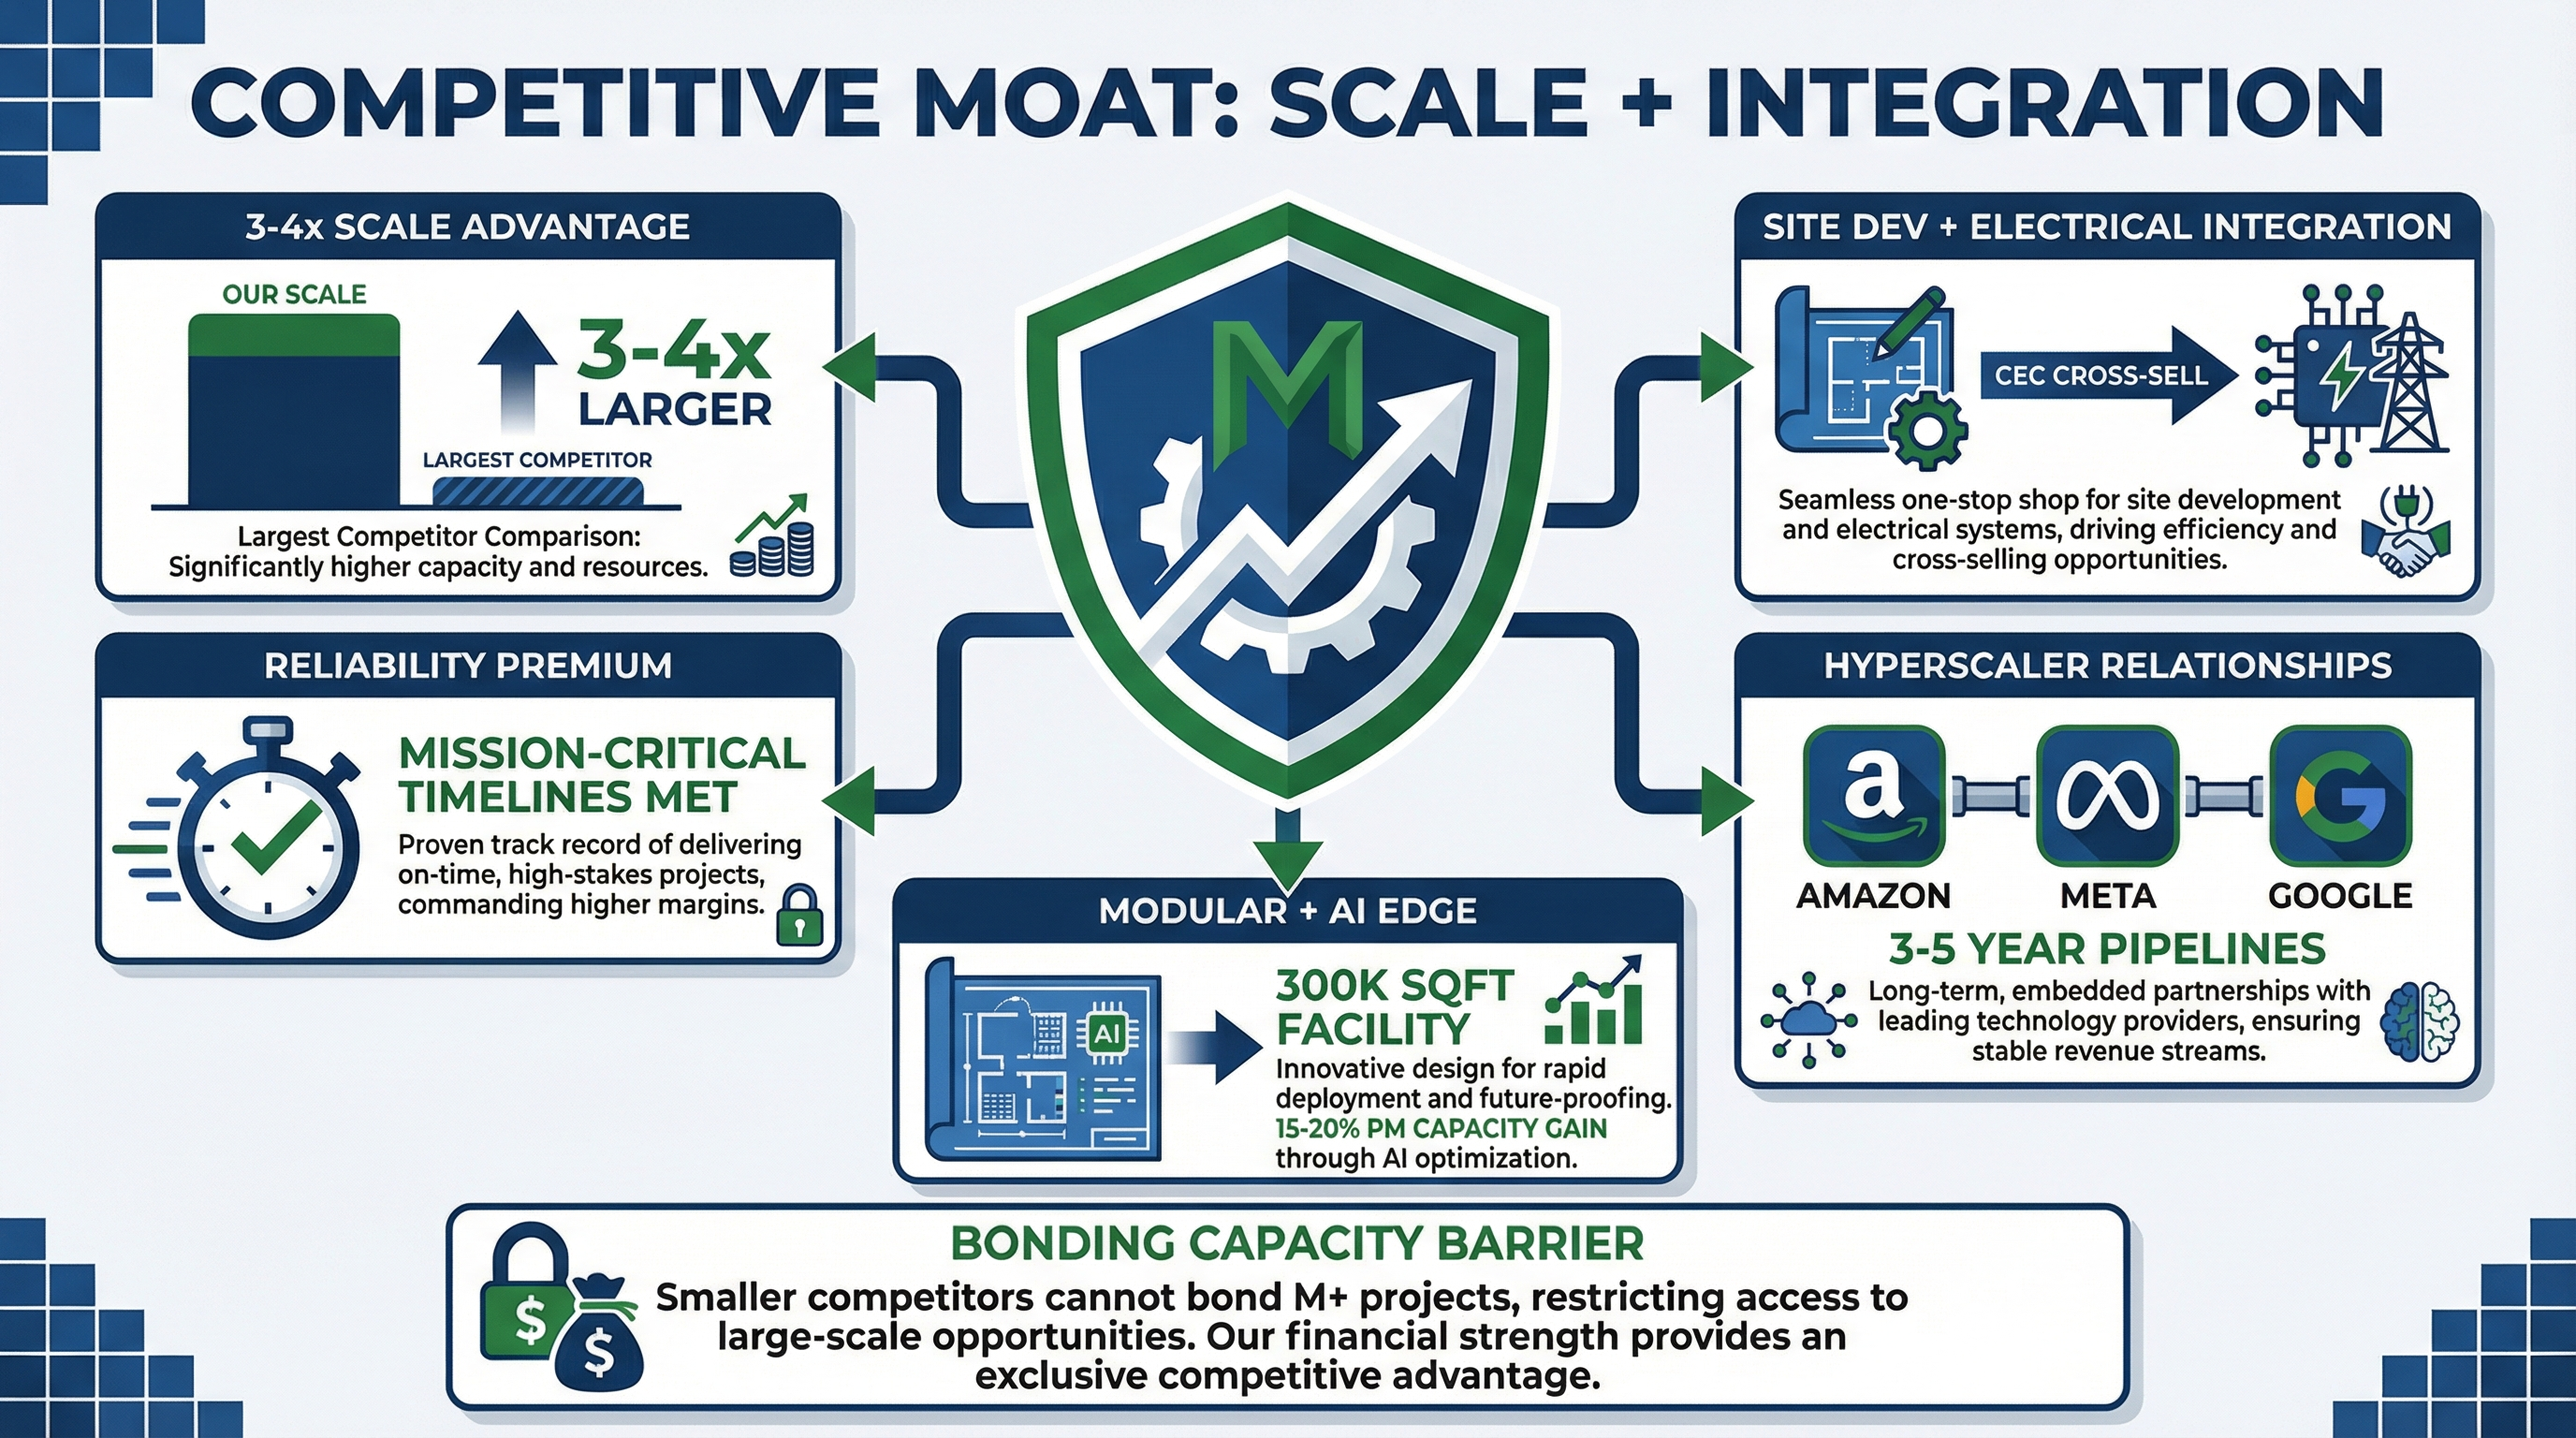
AI-generated infographic: "Schedule assurance" moat. Scale advantage (3-4x larger), integrated offering (site prep + electrical), safety record (10x industry avg), owned equipment fleet, and hyperscaler relationship stickiness.
Visual Appendix: Backlog & Visibility Pool Analysis
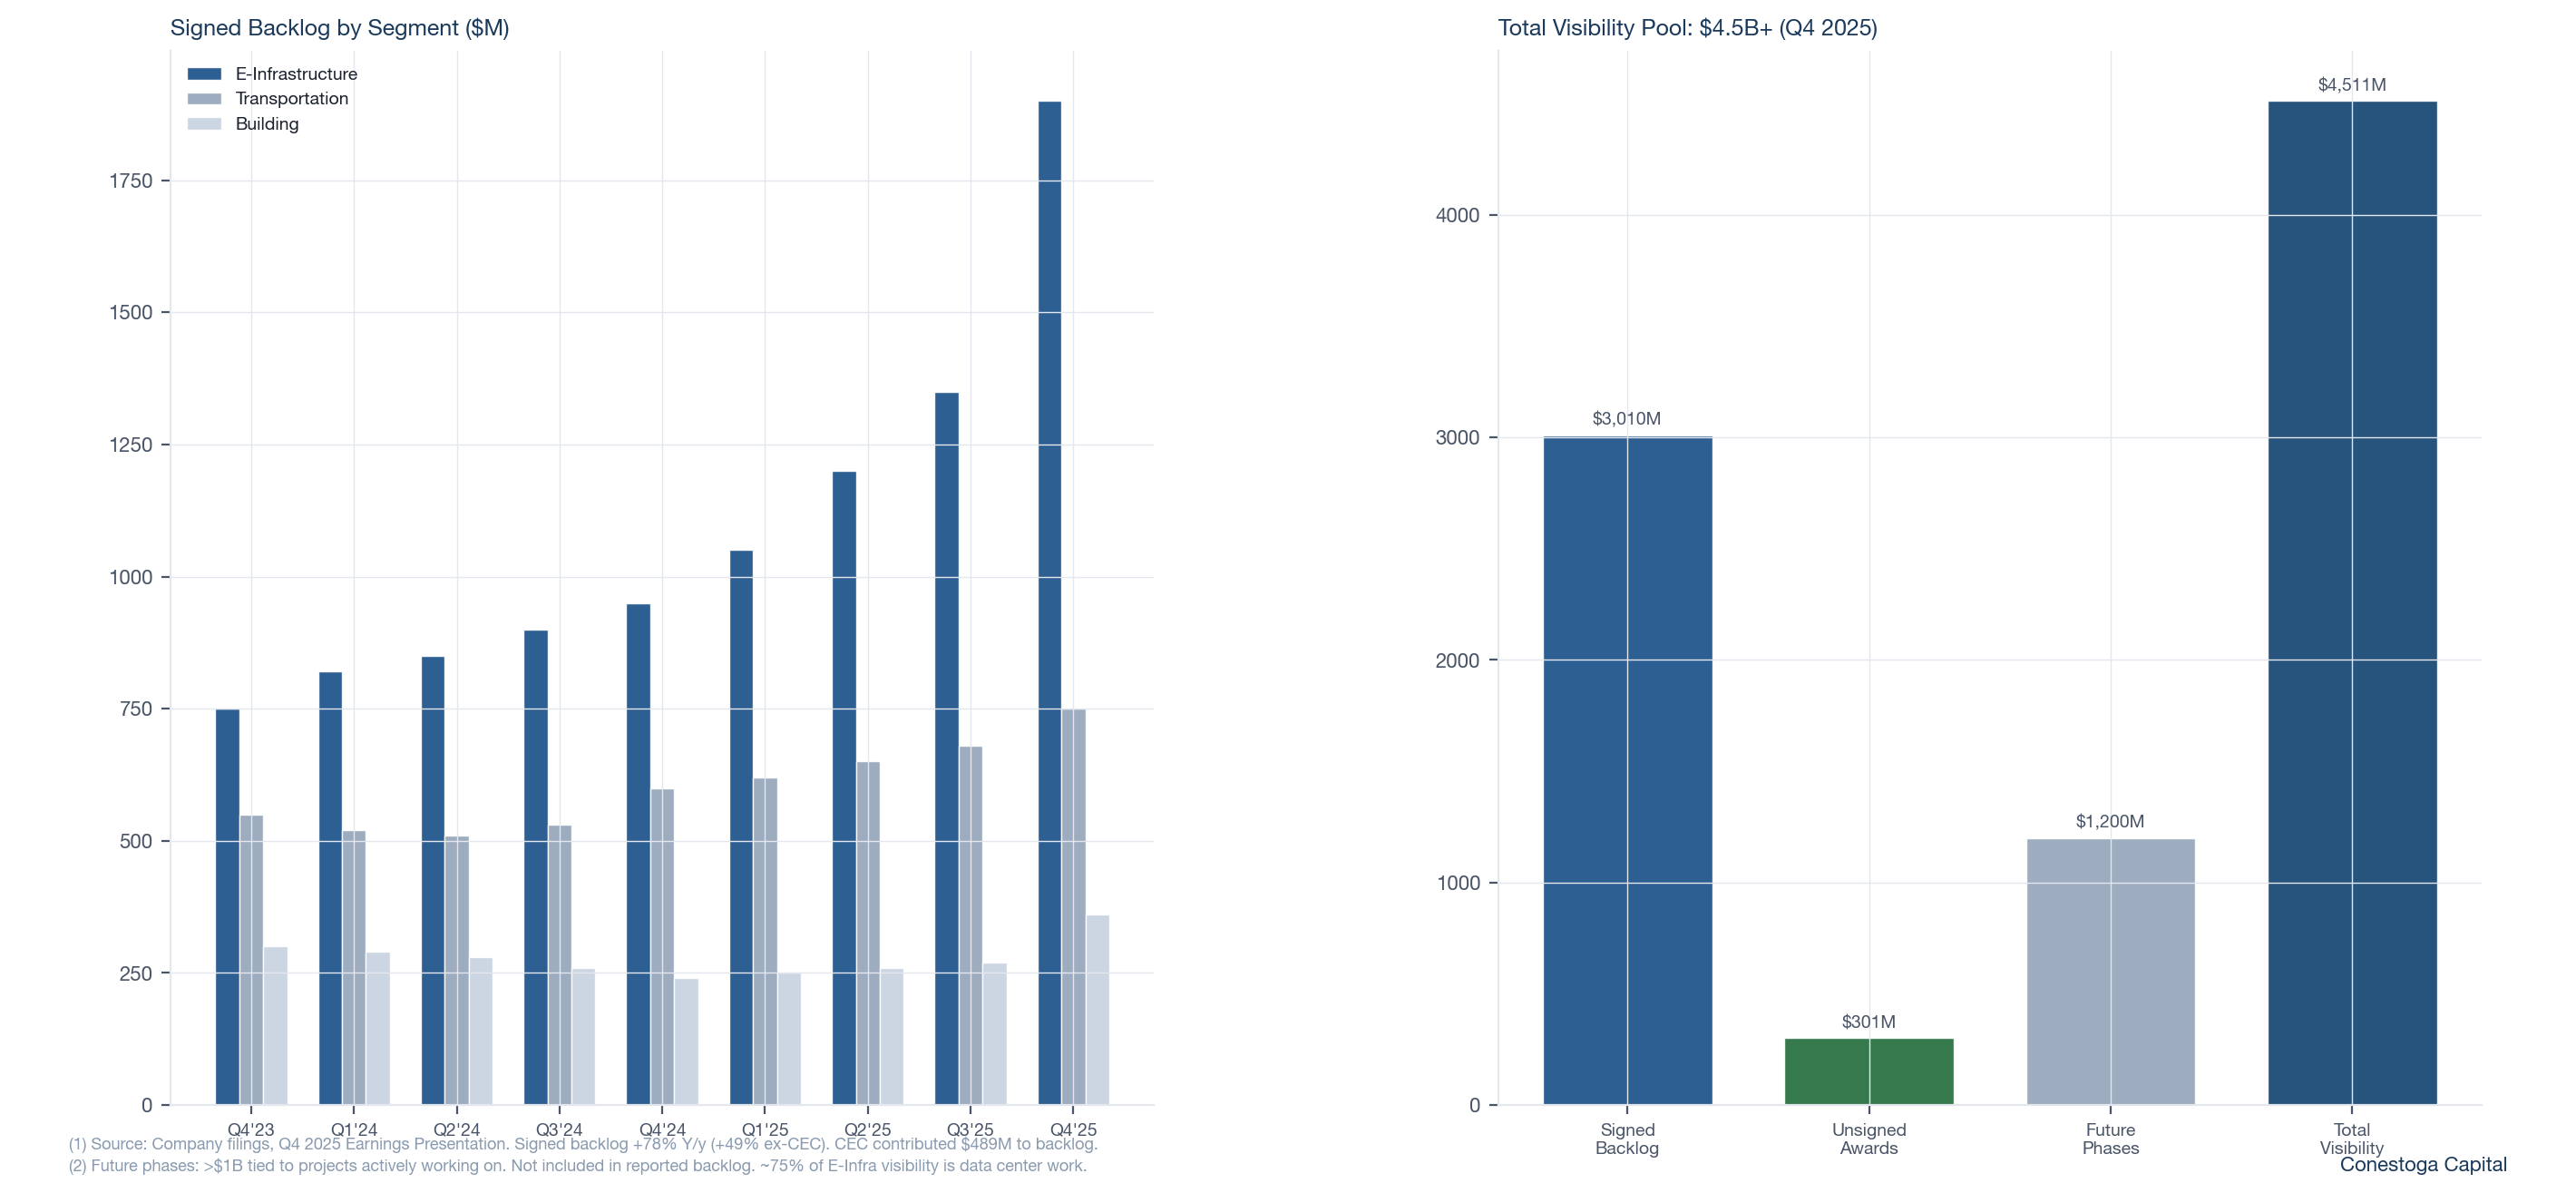
Signed backlog +78% Y/y (+49% ex-CEC). $4.5B total visibility pool: $3.01B signed backlog + $301M unsigned awards + $1.2B+ future phases. ~75% of E-Infra visibility is data center work.